Direction and Rate of Technological Change
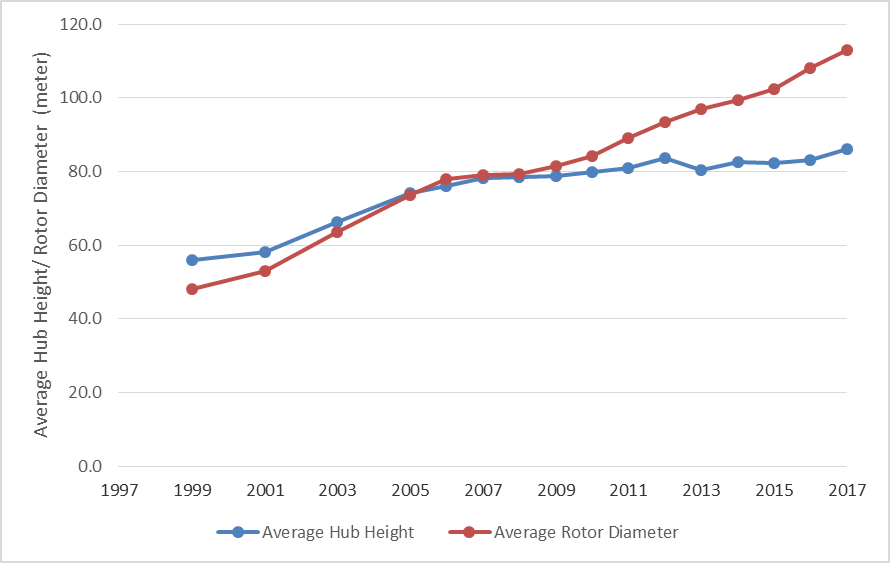
Structural reliability is key to the design of a turbine tower. The tower must be built so it can handle the heavy static loads applied due to direct wind pressure and turbine weight. In addition, the tower design is optimized by considering the energy yield gain and costs. Tower height has increased over time, motivated by rotor blade diameter increases over the past two decades. As the tower height increases, wind turbines have access to a steadier wind speed profile at higher altitudes and generate high power output for a given turbine rating and rotor diameter. In the current market, the tubular steel tower is the most prominent design because of its high strength-to-weight ratio and comparatively low cost.
However, the growing demand for taller towers has posed several transportation challenges, including requiring large cranes for installation, increasing site development costs, and potentially longer lead times. Therefore, concrete-made towers have emerged as an alternative to tubular steel towers, with the comparative advantages of potential cost savings in transportation and site development, no local buckling problems, and greater corrosion resistance. Another design alternative, hybrid steel-concrete towers, combines the advantage of tubular steel sections on top and a concrete base on the bottom. This hybrid design reduces the challenges of transporting large diameter steel-tubes and makes the tower’s overall seismic weight lower than concrete towers.

Figure IO.1 Trends in Turbine Hub Height and Rotor Diameter
Source: Recreated from Figure 20 of Wiser et al. (2017) 2017 Wind Technologies Market Report. U.S. Department of Energy, Office of Energy Efficiency & Renewable Energy.
Data on Quantity, Cost, and Quality
Table IO.1 Attributes for Learning Curve Estimation
Source: Data from Figures 12 and 20 in U.S. Department of Energy 2017 Wind Technologies Market Report
| Year | Tower Production Capacity (number of towers) | Average Hub Height (meters) |
| 1998-99 | 56 | |
| 2000-01 | 58 | |
| 2002-03 | 66 | |
| 2004-05 | 74 | |
| 2006 | 76 | |
| 2007 | 78 | |
| 2008 | 78 | |
| 2009 | 79 | |
| 2010 | 80 | |
| 2011 | 81 | |
| 2012 | 3,823 | 84 |
| 2013 | 4,285 | 80 |
| 2014 | 3,714 | 83 |
| 2015 | 3,119 | 82 |
| 2016 | 3,150 | 83 |
| 2017 | 3,220 | 86 |
| Source: | Figure 12 | Figure 20 |

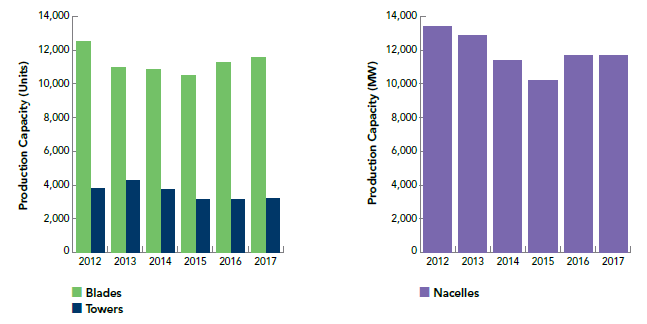
Figure IO.2 Manufacturing Production Capacity for Major Components of Towers, Blades and Nacelle
Source: Figure 84 from AWEA 2017 U.S. Wind Industry Annual Market Report Year