Market Structure
Due to market uncertainty caused by the expiration of the Production Tax Credit (PTC) at the end of 2012, total new wind project capacity installed during 2013 dropped by 92% and many smaller turbine manufacturers were forced to reassess their position in the U.S. market. A series of market consolidations has taken place since then, including the significant 2016 merger of Nordex and Acciona Windpower, as well as the recent merger of Gamesa and Siemens (effective in April 2017). Going forward, the industry will likely continue to be dominated by a few major turbine manufacturers. Table SC.1 summarizes the market shares of installed wind capacity by major manufacturer in 2017. Table SC.2 summarizes some of the major acquisition events that took place in the wind turbine manufacturing industry in recent years.
Table SC.1 Market Share of U.S. Wind Power Installed Capacity in 2017
Source: Figure 66 from AWEA 2017 U.S. Wind Industry Annual Report
| Turbine Manufacturer | Capacity (MW) | Market Share |
| Vestas | 2,481 | 35.4% |
| GE Renewable Energy | 2,066 | 29.4% |
| Siemens Gamesa Renewable Energy | 1,625 | 23.2% |
| Nordex USA | 806 | 11.5% |
| Other | 37 | 0.5% |
| Total | 7,008 | 100.0% |
Table SC.2 Recent Acquisition Events by Major Wind Turbine Manufacturer
Source: Compiled by authors
| Turbine Manufacturer | Year of Merger Completion | Company Acquired | Service Expansion |
| Vestas | 2015 | UpWind Solutions | Wind service business |
| 2016 | Availon | Wind service business | |
| Nordex | 2016 | Acciona Windpower | OEM |
| GE Renewable Energy | 2015 | Alstom SA’s power business | Offshore wind business |
| 2015 | Blade Dynamics | Modular Blade technology | |
| 2017 | LM Wind Power | In-house blade manufacturing | |
| Siemens | 2005 (ends in 2017) | Winergy Drivesystems | In-house nacelle manufacturing |
| 2017 | Gamesa |
Porter’s Five Forces
In this section, we begin by exploring Porter’s five forces in on-shore wind turbine manufacturing; specifically, these are: the threat of new entrants, the threat of established rivals, the threat of substitute products or services, the bargaining power of suppliers, and the bargaining power of customers. The framework is illustrated in Figure SC.1 below and characteristics of each of the forces will be discussed in detail subsequently in the context of on-shore wind turbine manufacturing.

Figure SC.1 Porter’s Five Forces
- Industry Rivalry:
Even though the wind turbine manufacturing market is dominated by few companies, the competitive level in this industry is still high and continuing to increase. Some companies focus on wind turbines only and some are part of large multinational companies, so they use different business strategies to position themselves in the market by their competitive advantage. Wind turbine manufacturers compete with each other on price (through alterations in manufacturing processes, distribution arrangements, etc.) and product quality. Companies that can provide effective differentiated technologies and wind turbine design generally attract more customers.
- Threat of New Entrants (Low and Steady):
The wind turbine manufacturing industry requires a large amount of capital in the form of plant and equipment. The turbine manufacturing industry is currently led by three major long-standing American and European manufacturers; as these companies have substantial expertise, knowledge, and research and development capacity, threat of new entrants in this industry is considered very low.
- Threat of Substitutes (High and increasing):
Potential substitutes for wind power include other renewable energy sources (e.g., utility-scale solar, hydro, geothermal, and biofuel) and traditional carbon-intensive fossil fuel options. Among renewable sources, wind energy faces competition from decreasing solar energy costs following government support, technological breakthrough, and returns to economies-of-scale in solar panel production. Wind energy also faces competition from fossil fuel generators. In recent years, low U.S. natural gas prices have contributed to an increase in natural gas power, which has displaced a great amount of coal-fired energy generation and may pose a competitive threat to wind power if its price remains low.
- Bargaining Power of Suppliers (Low and Increasing):
The bargaining power of suppliers decreases when an industry can control their suppliers either by acquiring them (vertical integration) or by negotiating long-term commitments. Vertical integration allows wind turbine manufacturers to control of the quality and delivery of raw material and components; however, vertical integration may pose a risk to manufacturers during economic downturns because it reduces their ability to adjust production capacity quickly. Given the recent market fluctuations due to policy uncertainties, some wind turbine manufacturers have restructured organizationally to purchase more components from external suppliers.
- Bargaining Power of Buyers (Medium and Increasing):
There are two type of buyers of wind turbines: 1) the owner of the wind power project, and 2) buyers of wind-generated electricity. Typically a wind power project is purchased by a utility company, local government, or investment company. They are constantly evaluating all the factors that will affect the profitability of the project. Transition to power auction also help lower the costs per unit of electricity generated by on-shore wind projects, which further squeeze down the profit that wind turbine manufacturers can make.
Overview of Geography
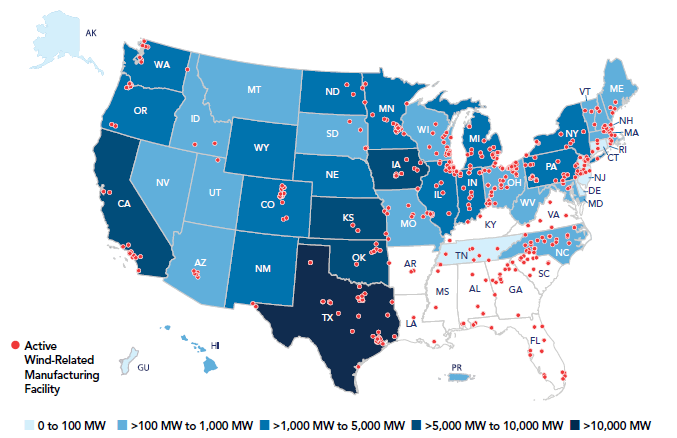
The distribution of wind turbine manufacturing establishments is correlated with the distribution of downstream wind power production to some extent in the U.S. As shown in Figure SC.2, there is overlap between the active wind-related manufacturing facilities and regions with greater wind power capacity, such as Taxes, a leading producer of wind power and top destination for turbine manufacturers as well. States in the Southeast region, on the other hand, is a wind manufacturing hub supplying components and materials to the industry even though it is currently not a major wind project development region.
The majority of wind projects are concentrated in regions with abundant wind sources, such as the Great Plains, the Midwest, and the state of Texas. In these areas, wind energy contributed more than half of all new electricity generation capacity between 2013 and 2017. Of the wind power capacity installed in 2017, 83% were installed either in the Plains states, the Midwest or Texas. However, due to advances in rotor blade design, larger rotor diameters allow for viable wind projects in regions with lower wind speeds, including many parts of the Great Lakes, the Northeast, and the Southeast.

Figure SC.2 Map of U.S. Wind Power Capacity and Manufacturing Facilities
Source: Figure 82 from AWEA 2017 U.S. Wind Industry Annual Market Report
In 2017, there are over 500 wind-related manufacturing facilities spread across 41 states. The Great Lakes region has the highest concentration of wind-related manufacturing activity and Ohio is the leading state in terms of the number of wind manufacturing facilities if including subcomponent manufacturing (60 active plants). As many of the components in wind turbines are similar to those used in engines and other auto parts, this region is concentrated with wind industry suppliers due to its historic dominance of the auto sector. Additionally, industry manufacturers in this region are situated close to Canada, the industry’s largest export market, as well as the Great Plains region, representing 23% of the United States installed wind power capacity. Similarly, the Southeast region house a great number of wind-related manufacturing facilities, and the concentration of these industry suppliers has less to do with downstream demand than with the presence of active automobile industry activities in the region. In addition, the region has ready access to ports that supply components to fast-growing wind power markets overseas. Within the region, North Carolina has the highest number of wind subcomponent manufacturing facilities with about 26 active plants.

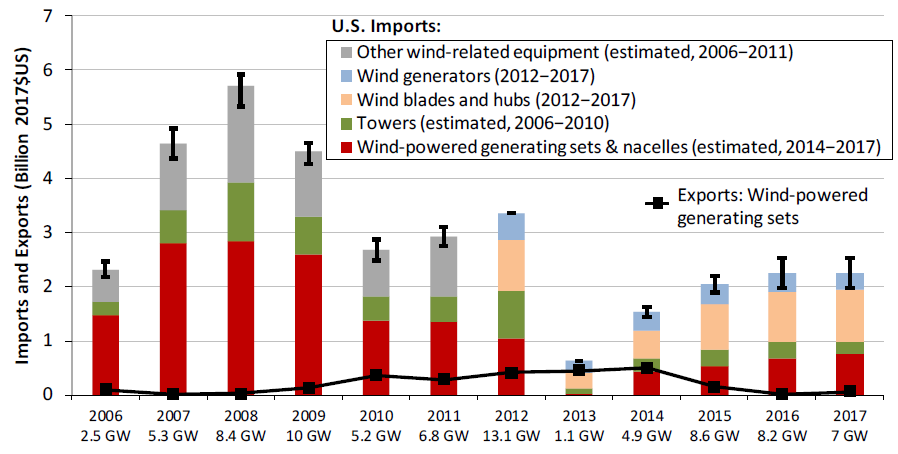
Figure SC.3 Estimated Imports and Exports of Various Wind Turbine Components
Source: Figure 14 of Department of Energy 2017 Wind Technology Market Report, original data from USITC DataWeb: http://dataweb.usitc.gov
Overview of Governance
State and federal mandates and policy incentives for renewable energy have been the primary drivers of demand for wind turbines, vital in reducing the cost of wind power to a level that is price-competitive with more conventional carbon-intensive energy sources. The major wind turbine components, such as blades, nacelles and towers are very large, so overseas shipments of these components are not economical for wind turbine manufacturers. However, many of the internal components of wind turbines are traded internationally. In recent years, greater demand for wind energy production has led to a greater share of domestic U.S. production of turbines and internal components.
The most influential policy incentive supporting U.S. wind energy has been the Production Tax Credit (PTC). The PTC supports wind and other renewable energy projects, keeping renewable generation competitive with fossil fuels and sustaining demand for turbines. When PTC was
enacted in 1992 as a part of the Energy Policy Act, it provided an adjusted tax credit of 1.5 cent per kWh of wind-generated electricity. The PTC requires periodic renewal by Congress, and since its inception several lapses have occurred, resulting in subsequent breaks in new wind project construction. In the end of 2015, Congress passed the most recent extension of the tax credit with bipartisan support. The legislation allows wind projects under construction as of 2015 and 2016 to receive a full tax credit of 2.4 cents per kWh. It then calls for a phasedown of the credit through a 20.0% reduction each year through 2019, when the credit will expire.
In July 2012, the U.S. Department of Commerce established tariffs against Chinese and Vietnamese manufacturers of wind towers, which was the first ever import tariff in the wind manufacturing industry. According to the Department of Commerce, these overseas manufacturers were selling the towers below the cost of production and “dumping” them into the U.S. market because of an oversupply in their respective countries. The tariff for Chinese manufacturers are between 20.9% and 72.7%, while tariffs on Vietnamese manufacturers vary between 52.7% and 59.9%.
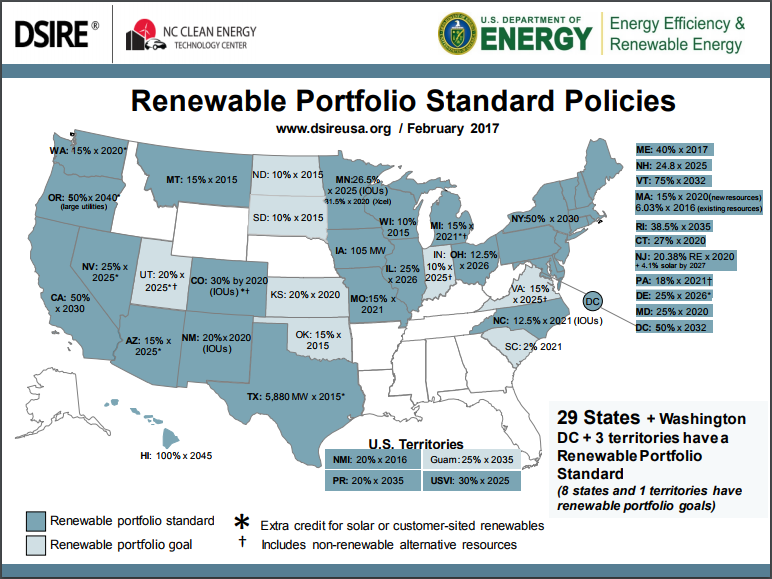
On the state level, renewable portfolio standards (RPS) require utilities to generate a certain portion of their electricity from renewable sources, including wind. These requirements vary by state; currently 29 states and the District of Columbia have established renewable portfolio standards (Figure SC.4). RPS requirements are thought to be responsible for 60% of the total increase in U.S. renewable electricity generation since 2000. RPSs’ role appears to have declined in recent years from 71% of new U.S. renewable energy projects in 2013 to 46% in 2015.
Figure SC.4 Nationwide Renewable Portfolio Standard Policies
Source: DSIRE database, www.desireusa.org
Quantitative Measurement of Imperfect Competition
Four Firm Concentration Ratio (FFCR)
“Turbine and Turbine Generator Set Units Manufacturing” (NAICS 333611) is the closest six-digit code industry that covers the wind turbine manufacturing step. Note that this industry code also includes a range of components, products or services other than wind turbine manufacturing. Table SC.3 details the data used to calculate the FFCR for wind turbine manufacturers.
Table SC.3 FFCR for Turbine and Turbine Generator Set Units Manufacturing (NAICS 333611)
Source: 2012 U.S. Economic Census, Manufacturing: Subject Series: Concentration Ratios: Share of Value of Shipments Accounted for by the 4, 8, 20, and 50 Largest Companies for Industries: 2012
| Year | Firms | Number of Companies | Number of Establishments | Number of Employees | Total Value of Shipments ($1,000) | % of Value of Shipment from ____Large Firms | % of Value of Shipment by HHI for 50 Largest Firms |
| 2012 | All firms | 137 | 183 | 36955 | $16,919,698 | 100 | |
| 2012 | 4 largest firms | $10,371,775 | 61.3 | ||||
| 2012 | 8 largest firms | $12,317,540 | 72.8 | ||||
| 2012 | 20 largest firms | $14,466,342 | 85.5 | ||||
| 2012 | 50 largest firms | $16,073,713 | 95 | 1263.2 |
Herfindahl-Hirschman Index (HHI)
Based on market shares of major wind turbine manufacturers presented in Table SC.1, the HHI for the wind turbine industry is estimated to be around 2,800.
Firm Economic Data Table
Table SC.4 lists firm revenues, number of employees, as well as location of headquarter and manufacturing facilities. More detailed firm information can be found in their annual report or company website (link provided).
Table SC.4 Detailed Economic Data for Major Wind Turbine Manufacturers in the U.S.
Source: Compiled by authors based on company’s annual financial report or online website
| Company Name | Country of Headquarter | Countries of Manufacturing | Number of Employees | Revenue (million) | Source |
| GE Renewable Energy* | France | USA, Canada, Brazil, EU, Turkey, China, India, Vietnam | 21,000 | $10,280 | 2017 Annual Report |
| Vestas | Denmark | USA, Denmark, Germany, Italy, Spain, China, India, Brazil | 23,303 | $11,634 | 2017 Annual Report |
| Siemens Gamesa Renewable Energy | Spain | 25,000 | $6,538 | 2017 Annual Report | |
| Mitsubishi | Japan | n/a | $13,136 (energy and environment segment) | 2017 Annual Report | |
| Nordex USA | USA (Nordex SE in Germany) | 5,260 (Nordex SE) | 3,598 (Nordex SE) | 2017 Annual Report | |
| Suzlon | India | India | 7,600 | 1,272 | 2017 Annual Report |
| Clipper | USA | USA | 51-200 | n/a | Company Website |
| Senvion | Germany | 4,500 | 2,210 | 2017 Annual Report | |
| Goldwind | China | China | 8,000 | 6,277 | 2017 Annual Report |
