Direction and Rate of Technological Change
Though a typical wind turbine comprises a variety of modules and components, there is a well-established consensus around the definition of basic wind turbine architecture, which has three blades that rotate on a horizontal-axis, faces upwind, and allows for variable speeds and pitch regulation. This dominant wind turbine design outperforms other alternatives by achieving higher reliability and efficiency, and can be produced at lower cost. In contrast to this fixed architecture, the technology of the drive train has become a focus for innovation, leading to a variety of alternative configurations. We provide more detailed discussion separately on the dominant design and technology innovation for each sub-step of the turbine manufacturing value chain step (rotor module, nacelle module, and tower module).
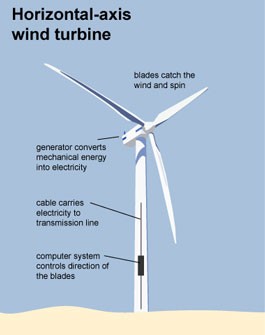
Figure IO.1 Design of a Horizontal Axis Wind Turbine
Source: https://www.eia.gov/energyexplained/index.php?page=wind_types_of_turbines
In addition to the technological advancement in turbine components, major turbine manufacturers also invest in the improvement of software platforms that can streamline wind farm operations, reduce maintenance costs, and optimize wind resources, further decreasing the levelized cost of electricity for wind energy.
Recent advances in wind turbine technologies and siting techniques have contributed to a substantial increase in the average nameplate capacity of newly installed wind turbines. The average capacity rating of a wind turbine installed in 2017 was 2.32 MW, an increase of nearly 29% from 1.80 MW in 2010. Simultaneously, technological advances in the electronic components used in turbines have improved turbine reliability.
Rotor diameters have increased significantly in the past two decades, and the hub height has increased slightly. The average turbine installed in 2017 grew slightly to 86 meters in hub height and stretched to 113 meters in rotor diameter, an increase of 34% as compared to average turbine installations in 2010. Figure IO.1 depicts the overall trends of wind turbine capacity and average rotor diameter and hub height in the past two decades.
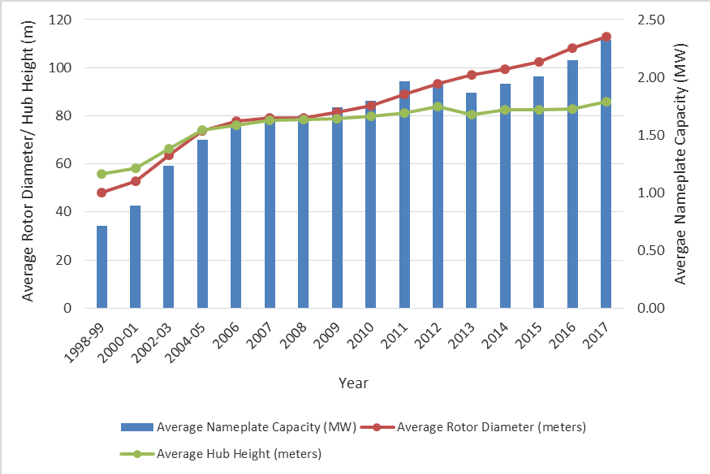
Figure IO.2 Historical Trends of Wind Turbine Capacity, Rotor Diameter and Hub Height
Source: Recreated from Figure 20 in U.S. Department of Energy 2017 Wind Technologies Market Report
Rotor diameter and hub height are the two major elements impacting the project-level capacity factor, wind turbine performance measure. Larger rotor diameters enable greater swept area of the blades, resulting in greater energy capture for each watt of rated turbine capacity. Increasing hub heights allows wind turbines to access steadier wind speed profiles at higher altitudes, which improves energy production for a given turbine rating and rotor diameter. With advancements in average rotor diameter and hub height, the performance of wind turbines has improved over time, as indicated by the upward trend in capacity factor in Figure IO.2.
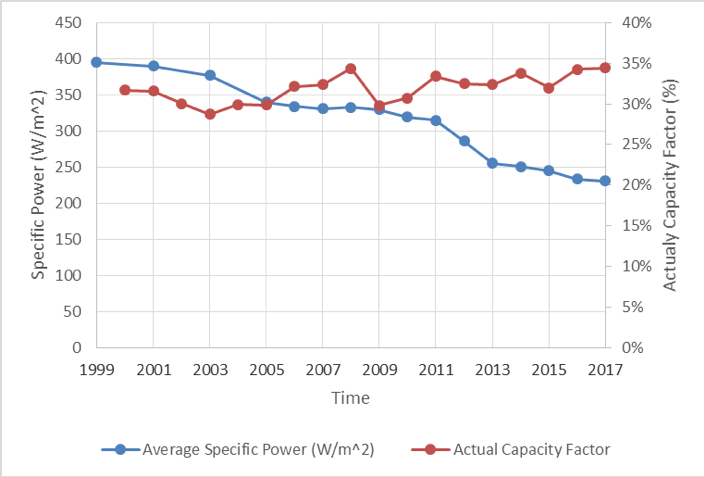
Figure IO.3 Historical Trends of Average Specific Power and Capacity Factor
Source: Recreated from Figure 24 and 33 in U.S. Department of Energy 2017 Wind Technologies Market Report
Department of Energy (DOE) partners with public and private organizations to develop advanced wind technologies for wind turbine component, systems, and modeling methods to help accelerate domestic wind industry. More information on the works of DOE’s Wind Energy Technologies Office (WETO) can be found here: https://www.energy.gov/eere/next-generation-wind-technology.
Data on Quantity, Cost, and Quality
The cost of wind energy can be considered in several ways, including turbine price, wind power project cost, and levelized cost of electricity (LCOE) produced from wind. Table IO.1, Table 1O.2 and Figure IO.4 include historical data on cumulative wind capacity, wind energy costs and various quality attribute measurements that can be used as inputs for developing learning curve analysis for wind energy.
Table IO.1 Attributes for Learning Curve Estimation
Source: Data from Figures 2, 40, and 41in U.S. Department of Energy 2017 Wind Technologies Market Report
| Year | Quantity | Cost | ||
| Annual U.S. Wind Capacity (GW) | Cumulative U.S Wind Capacity (GW) | Average Wind Turbine Price (2017 $/kW)* | Installed Wind Power Project Costs (2017$/kW) | |
| 1982 | ||||
| 1983 | $4,387 | |||
| 1984 | $4,678 | |||
| 1985 | $3,360 | |||
| 1986 | $3,525 | |||
| 1987 | $2,163 | |||
| 1988 | ||||
| 1989 | $2,768 | |||
| 1990 | $3,132 | |||
| 1991 | ||||
| 1992 | $2,395 | |||
| 1993 | $2,485 | |||
| 1994 | $1,938 | |||
| 1995 | $2,001 | |||
| 1996 | $1,632 | |||
| 1997 | $1,589.12 | $2,644 | ||
| 1998 | 0.142 | 1.512 | $1,216.41 | $1,505 |
| 1999 | 0.844 | 2.385 | $788.01 | $1,767 |
| 2000 | 0.071 | 2.456 | $871.86 | $1,779 |
| 2001 | 1.690 | 4.147 | $832.18 | $1,397 |
| 2002 | 0.411 | 4.557 | $1,097.75 | $1,633 |
| 2003 | 1.665 | 6.222 | $1,113.64 | $1,483 |
| 2004 | 0.396 | 6.619 | $1,370.54 | $1,366 |
| 2005 | 2.374 | 8.993 | $1,405.33 | $1,603 |
| 2006 | 2.457 | 11.450 | $1,537.21 | $1,789 |
| 2007 | 5.253 | 16.702 | $1,747.11 | $1,969 |
| 2008 | 8.362 | 25.065 | $1,621.87 | $2,201 |
| 2009 | 10.005 | 35.068 | $1,607.62 | $2,407 |
| 2010 | 5.216 | 40.283 | $1,450.44 | $2,403 |
| 2011 | 6.820 | 46.930 | $1,247.28 | $2,304 |
| 2012 | 13.131 | 60.012 | $1,269.79 | $2,081 |
| 2013 | 1.087 | 61.110 | $1,082.93 | $1,961 |
| 2014 | 4.854 | 65.877 | $1,282.18 | $1,825 |
| 2015 | 8.598 | 73.992 | $897.10 | $1,648 |
| 2016 | 8.203 | 82.143 | $1,589.12 | $1,609 |
| 2017 | 7.017 | 88.973 | n/a | $1,611 |
| Source4 | Figure 2 | Figure 42 | Figure 43 | |
*The average wind turbine prices include transaction prices reported from different order sizes (<5 MW, 5-100 MW and >100MW)
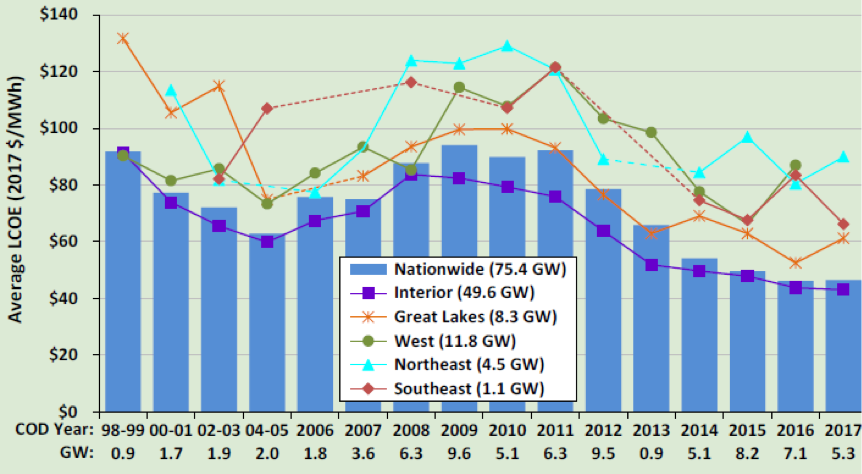
Figure IO.4 Trends of U.S. National and Regional LCOE for Wind Energy
Source: Page 65 of U.S. Department of Energy 2017 Wind Technologies Market Report
Table IO.2 Historical Data on Various Quality Attributes
Source: Figures 20, 24, and 33 of U.S. Department of Energy 2017 Wind Technologies Market Report
| Year | Quality Attributes | ||||
| Average Nameplate Capacity (MW) | Average Rotor Diameter (meters) | Average Hub Height (meters) | Average Specific Power (W/m2) | Net Capacity Factor (actual) | |
| 1998 | |||||
| 1999 | 0.72 | 48 | 56 | 395 | |
| 2000 | 31.66% | ||||
| 2001 | 0.89 | 53 | 58 | 390 | 31.59% |
| 2002 | 30.01% | ||||
| 2003 | 1.23 | 64 | 66 | 377 | 28.74% |
| 2004 | 29.91% | ||||
| 2005 | 1.43 | 73 | 73 | 340 | 29.86% |
| 2006 | 1.61 | 78 | 76 | 334 | 32.13% |
| 2007 | 1.65 | 79 | 78 | 331 | 32.36% |
| 2008 | 1.67 | 79 | 78 | 332 | 34.34% |
| 2009 | 1.74 | 82 | 79 | 329 | 29.78% |
| 2010 | 1.80 | 84 | 80 | 319 | 30.71% |
| 2011 | 1.97 | 89 | 81 | 315 | 33.39% |
| 2012 | 1.95 | 93 | 84 | 286 | 32.48% |
| 2013 | 1.87 | 97 | 80 | 255 | 32.35% |
| 2014 | 1.94 | 99 | 83 | 251 | 33.78% |
| 2015 | 2.00 | 102 | 82 | 246 | 31.97% |
| 2016 | 2.15 | 108 | 83 | 233 | 34.25% |
| 2017 | 2.32 | 113 | 86 | 231 | 34.42% |
| Source | Figure 20 | Figure 20 | Figure 20 | Figure 24 | Figure 33 |
The total project cost of onshore wind energy has fallen significantly over time thanks to cost reduction in equipment, technology improvements and heighten competition in the industry.The International Renewable Energy Agency (IRENA) provides updated global learning curves for the installed costs of onshore wind power and the levelized cost of wind-based electricity (LCOE) for the period 1983-2014. The analysis examined 12 counties,including Brazil, Canada, China, Denmark, France, Germany, India, Italy, Spain, Sweden, the United Kingdom and the United States. The preliminary results show a global learning rates of 12% for LCOE between 1983 and 2014, suggesting significant improvements in global wind technology over the period (Figure IO.5).6, 7Wiser et al. (2016) used the historical LCOE for onshore wind in the U.S. to derive a learning rate of 17.8 % (Figure IO.6).
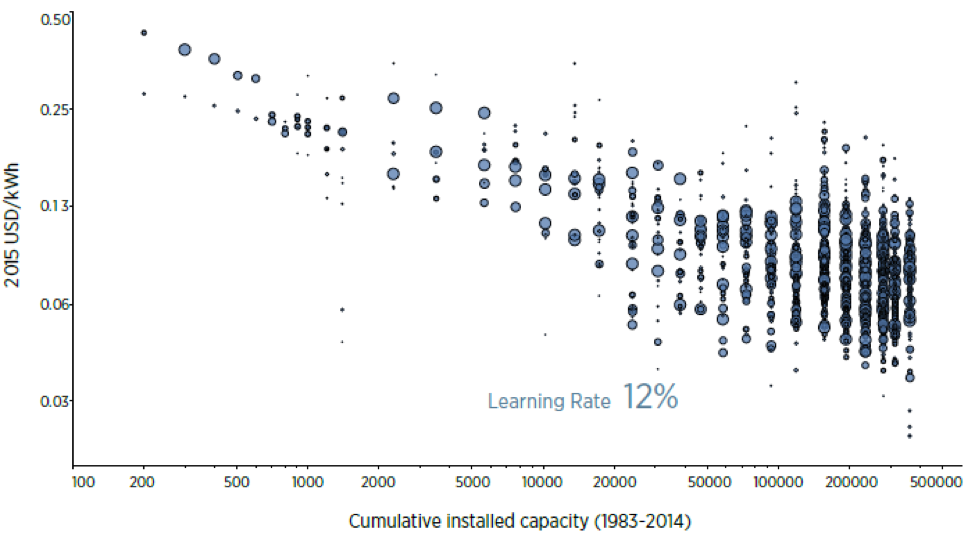
Figure IO.5 Global Onshore Wind Learning Curve Analysis
Source: Figure 2 from IRENA Q1 2017 Quarterly Report: Onshore Wind Industry Learning Fast
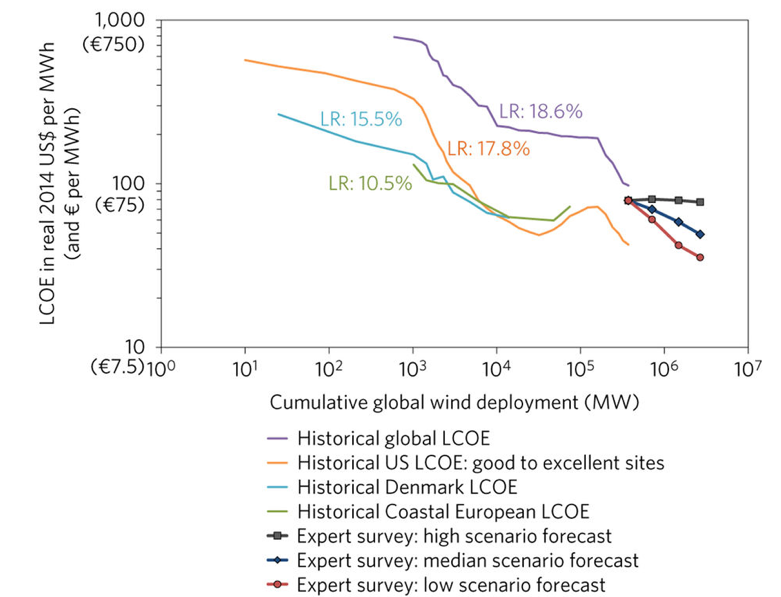
Figure IO.6 Historical and Forecasted Onshore Wind LCOE and Learning Rates
Source: Figure 5 from Wiser et al.(2016) “Expert elicitation survey on future wind energy costs.” Nature Energy, 1 (September 12, 2016): 1613.