Market structure
Porter’s Five Forces
In this section, we begin by exploring Porter’s five forces in on-shore wind farm project development and EPC; specifically, these are: the threat of new entrants, the threat of established rivals, the threat of substitute products or services, the bargaining power of suppliers, and the bargaining power of customers. The framework is illustrated in Figure SC.1 below and characteristics of each of the forces will be discussed in detail subsequently in the context of on-shore wind farm project development.

Figure SC.1 Porter’s Five Forces
- Industry Rivalry
According to AWEA’s wind database, more than 40 project developers installed a total of 8.2 GW wind power capacity in 2016. The top four firms account for around 50% of the installed capacity, indicating a medium level of market share concentration. In wind EPC, the level of internal industry competition is higher, as there is a limited number of contracting jobs. These wind turbine installers typically compete on the basis of price and reputation. Firms who can deliver high quality of work in a timely fashion have market advantage (IBIS 2017). Factors that impact a firm’s success by these measures include cost management strategies, availability of skilled research personnel, hiring practices for local labor, and secure supply of high-quality wind turbines and other BOP components.
- Threat of New Entrants
Given the level of capital expenses and expertise and the range of skilled labors required to build a large scale onshore wind farm, the barriers to entry for wind project development and EPC are high, especially for large-scale projects. New entrants may find it difficult to compete against more established wind project developers who have the advantage of knowledge and experience with managing and combining different aspects of project development (IBIS 2017). Federal, state, and local permitting and licensing requirements vary by location, which also create barriers to new entrants, who must pay related fees and learn to navigate these regulations.
- Threat of Substitutes
Wind project development and EPC experience some degree of threat of substitutes, mainly from competition with power plant contractors for other energy types (e.g., natural gas, other renewables, etc.). However, competition from fossil fuel power plant contractors has declined over the past five years due to government incentives for renewable energy. Historically, the global levelized cost of electricity (LCOE) of onshore wind energy had been lower than the LCOE of solar PV. However, solar power incentives are more generous in comparison to incentives for other renewable technology, including wind energy and hydroelectricity, and that has helped bring down the cost of solar by a significant amount in the past decade, bringing it into stronger competition with wind (Figure SC.2).
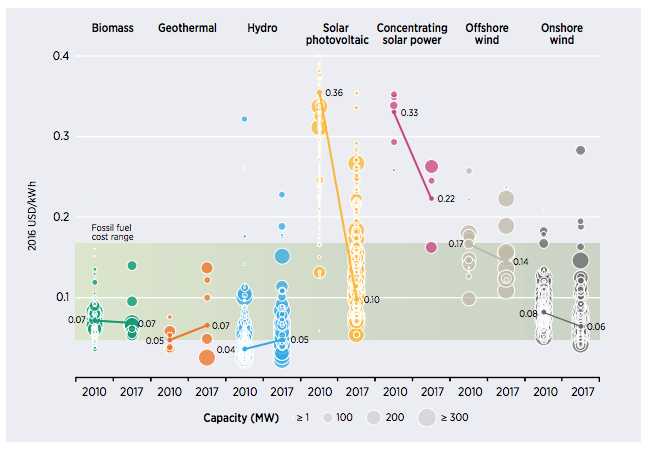
Figure SC.2 Global Levelized Cost of Electricity from Utility-Scale Renewable Power Generation Technologies, 2010-2017 (2016 $/MWh)
Source: Figure ES-1 from IRENA (2018) Renewable Power Generation Costs in 2017
- Bargaining Power of Suppliers
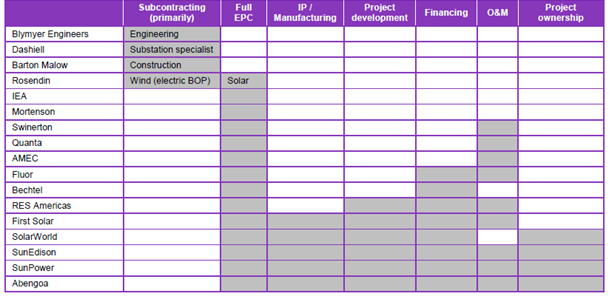
The primary suppliers in the context of onshore wind project development are mainly wind turbine manufacturers and construction machinery manufacturers. The bargaining power of suppliers differs based on a firm’s business model and breadth of services (Table SC.1). In contrast to the solar PV industry, vertical integration across manufacturing and project development is not common in the U.S. wind industry. The majority of the large wind project developers in the U.S. have in-house engineering and procurement resources, and hire external contractors to finish construction works. As wind turbine costs fall, wind project developers and EPC firms compete with very low margins. Hence, project developers who are able to obtain less expensive equipment from their suppliers than other developers are in a better competitive position.
Table SC.1 Breadth of Services for Selected EPC Firms in Renewable Industry
Source: Table 2 from Bloomberg New Energy Finance (2014) The Evolving Landscape for EPCs in U.S. Renewables
- Bargaining Power of Buyers
The “buyer” in the context of project development may be another project development firm (early in the process) or the final operator of the onshore wind project. A project developer may retain ownership of a project once the project is brought online, and thus have no “buyer” in this context. The bargaining power of buyers is expected to differ depending on the project developer’s business model and degree of competition. However, studies related to this specific topic are scarce and the understanding of the wind value chain would benefit from additional future research in this area.
Overview of Geography
The siting of onshore wind projects is heavily dependent on the quality of wind resources. A common way to measure the wind resource in a region is to examine local wind project capacity factors (Figure SC.3). States in the interior of the country (e.g., Great Plains and Midwest regions) lead the U.S. wind power performance with an average capacity factor above 40%. In recent years, technology advancements in wind turbine design has enabled wind projects to achieve higher wind performance in weaker wind resource areas. For instance, wind capacity factors in Missouri ranged between 25% and 30% in 2016; however, Missouri wind capacity factor now reaches 40% or higher in 2017 due to taller towers, larger rotor diameters, and better siting technology. Given the abundant wind resources in Texas, the Plains and the Midwest, 83% of the 7,107 MW new wind capacity installed in 2017 were in these regions (Table SC.2).
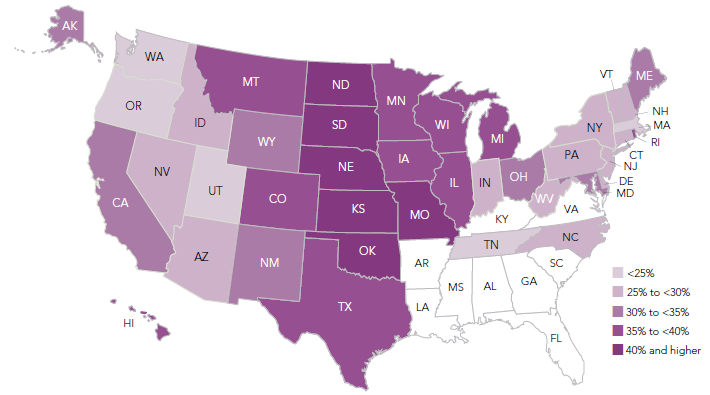
Figure SC. 3 State Wind Capacity Factors in 2017
Source: Figure 59 from American Wind Energy Association (2017) U.S. Wind Industry Annual Market Report Year Ending 2017. Original data from AWEA and EIA.
Table SC.2 State Wind Power Capacity Rankings
Source: Figure 22 from American Wind Energy Association (2017) U.S. Wind Industry Annual Market Report Year Ending 2017. Original data from AWEA and EIA.
| Rank | State | New capacity additions in 2017 (MWh) | Rank | State | Total installed capacity (MW) | Rank | State | One-year growth rate (%) |
| 1 | Texas | 2,305 | 1 | Texas | 22,599 | 1 | North Carolina | First utility-scale project |
| 2 | Oklahoma | 851 | 2 | Oklahoma | 7,495 | 2 | New Mexico | 51 |
| 3 | Kansas | 659 | 3 | Iowa | 7,308 | 3 | Missouri | 45 |
| 4 | New Mexico | 570 | 4 | California | 5,555 | 4 | Vermont | 25 |
| 5 | Iowa | 397 | 5 | Kansas | 5,110 | 5 | Michigan | 15 |
| 6 | Illinois | 306 | 6 | Illinois | 4,332 | 6 | Wisconsin | 15 |
| 7 | Missouri | 300 | 7 | Minnesota | 3,699 | 7 | Kansas | 15 |
| 8 | North Dakota | 249 | 8 | Oregon | 3,213 | 8 | Ohio | 13 |
| 9 | Michigan | 249 | 9 | Colorado | 3,106 | 9 | Oklahoma | 13 |
| 10 | Indiana | 220 | 10 | Washington | 3,075 | 10 | Indiana | 12 |
| 11 | North Carolina | 208 | 11 | North Dakota | 2,996 | 11 | Texas | 11 |
| 12 | Minnesota | 200 | 12 | Indiana | 2,117 | 12 | North Dakota | 9 |
| 13 | Nebraska | 99 | 13 | Michigan | 1,860 | 13 | Illinois | 8 |
| 14 | Wisconsin | 98 | 14 | New York | 1,829 | 14 | Nebraska | 7 |
| 15 | Colorado | 75 | 15 | New mexico | 1,682 | 15 | Iowa | 6 |
| 16 | Ohio | 72 | 16 | Wyoming | 1,489 | 16 | Minnesota | 6 |
| 17 | Oregon | 50 | 17 | Nebraska | 1,415 | 17 | Rhode Island | 3 |
| 18 | California | 50 | 18 | Pennsylvania | 1,369 | 18 | Maine | 3 |
| 19 | Vermont | 30 | 19 | South Dakota | 977 | 19 | Colorado | 2 |
| 20 | Maine | 23 | 20 | Idaho | 973 | 20 | Hawaii | 2 |
| Rest of U.S. | 7 | Rest of U.S. | 6,778 | Rest of U.S. | 3 | |||
As wind turbine towers become taller and blades become longer, the logistical challenge of transporting wind turbine components from production facilities or ports to the project construction site intensifies. To reduce transportation costs, most EPC firms are strategically located in close proximity to their customers. The geographic location of major wind EPC firms overlap with regions with greater wind energy share of electricity generation (Figure SC.4 and Figure SC.5). In addition, due to differences in construction regulations across state, some states, particularly New York and the New England region, have higher wind EPC costs than the rest of the U.S. (Figure SC.6).
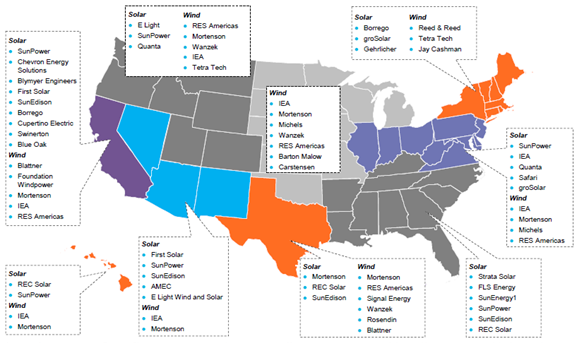
Figure SC.4 Top Wind EPC Firms by U.S. Region
Source: Figure 15 from Bloomberg New Energy Finance (2014) The Evolving Landscape for EPCs in U.S. Renewables
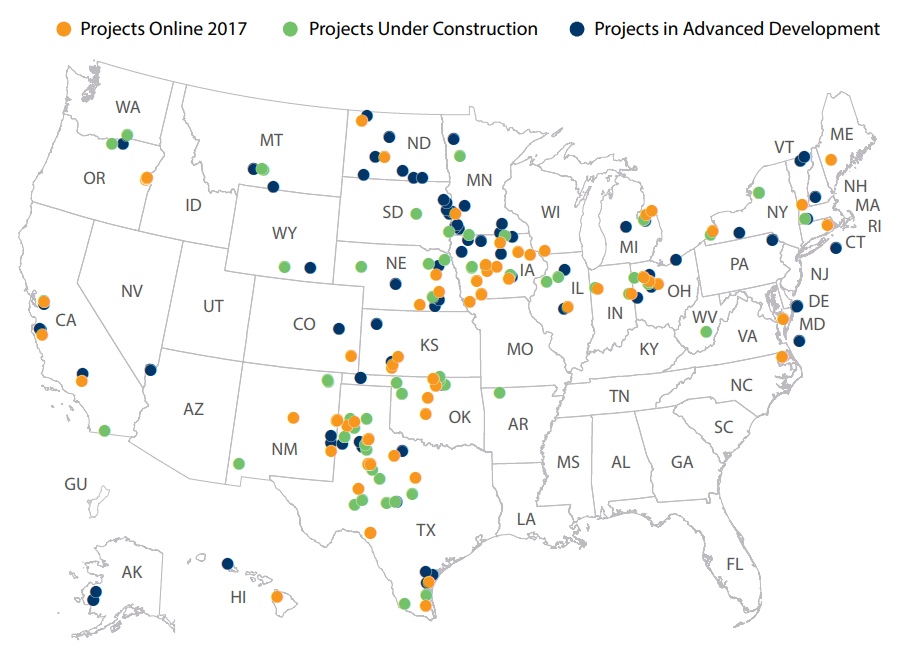
Figure SC.5 Map of Wind Projects in 2017
Source: Page 12 of American Wind Energy Association U.S. Wind Industry Fourth Quarter 2017 Market Report (AWEA Public Version)
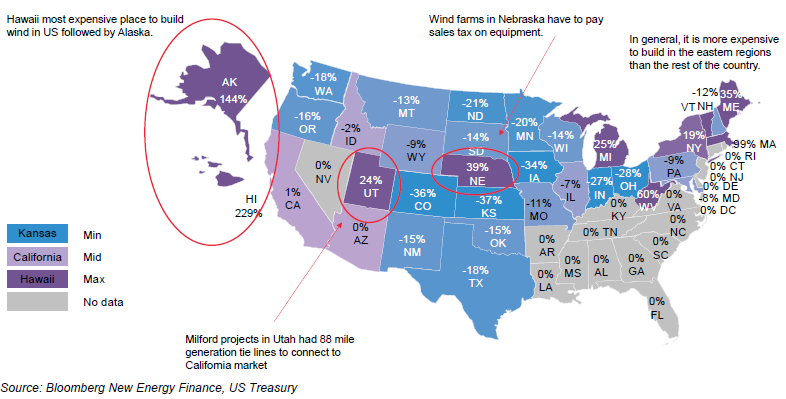
Figure SC.6 Average Estimate EPC Costs by State (% from U.S. Average)
Source: Figure 4 from Bloomberg New Energy Finance (2014) The Evolving Landscape for EPCs in U.S. Renewables. Original data from Bloomberg New Energy Finance and U.S. Treasury.
Overview of Governance
There are substantial upfront costs associated with wind energy projects, including purchasing and installing wind turbines, as well as upgrading transmission networks to account for the new power source. As a result, utilities have proved reluctant to invest in wind energy in the absence of federal incentives. In recent decades, government financial incentives and regulatory policies have become strong drivers of demand for renewable energy, including wind, and have been instrumental in reducing the cost of renewable power to a level that is price-competitive with more conventional fossil fuels. (IBIS 2017) Relevant policies are constantly evolving, and the differences in policies across countries, regions, and states strongly contribute to project developers’ choices of wind project locations.
Financial Incentives
Production Tax Credit (PTC)
The most influential policy incentive supporting U.S. wind energy has been the Production Tax Credit (PTC). The PTC supports wind and other renewable energy projects, keeping renewable generation competitive with fossil fuels and sustaining demand for turbines. When the PTC was enacted in 1992 as a part of the Energy Policy Act, it provided an adjusted tax credit of 1.5 cents per kWh of wind-generated electricity. The PTC has been subject to periodic short-term extensions by Congress; since its inception several lapses have occurred, resulting in subsequent breaks in new wind project construction. In late 2015, Congress passed the most recent extension of the PTC with bipartisan support. The legislation allows wind projects under construction as of 2015 and 2016 to receive a full tax credit of 2.4 cents per kWh. It then calls for a phasedown of the credit through a 20.0% reduction each year through 2019, when the credit will expire.
Alternatively, a wind project may receive an investment tax credit (ITC) in lieu of the PTC (i.e., a reduction in the project owner’s income tax liability). For ITC election for large wind projects, project developers can receive 30% of ITC in place of the PTC if the projects have commenced construction in 2015 and 2016. After 2016, the ITC then dropped to 24 percent in 2017, 18 percent in 2018, and will fall to 12 percent in 2019. As of the most recent extension, the ITC will not be available for large wind projects in 2020 or later years. Generally, the PTC has been (DSIRE database).
Loan Guarantee Program, Section 1705
Section 1705 Loan Guarantee Program of Title XVII, added by the American Recovery and Reinvestment Act authorized DOE to guarantee loans for certain clean energy projects, including onshore wind power. The loan guarantee program allowed project developers to gain access to low-cost financing and a higher amount of capital than private markets would provide without the program. The program awarded projects that commenced construction on or before September 30, 2011 and was suspended after that date.
Treasury Grant Program, Section 1603
Under Section 1603 of the American Recovery and Reinvestment Tax Act of 2009, qualifying commercial renewable energy projects can accept a cash payment from Department of Treasury regardless of their tax liability, under the Treasury Grant Program. Via the Treasury Grant Program, the Treasury pays grants equal to 30% of the cost of wind projects placed in service, which is equivalent to the tax write-off currently available under the ITC. The program was originally scheduled to terminate on December 31, 2010, but Congress extended it through December 31, 2011. Property that is not placed in service prior to December 31, 2011, can qualify for the grant program as long as construction has commenced prior to that date.
Other Renewable Energy Policies
Renewable Portfolio Standard (RPS)
At the state level, renewable portfolio standards (RPS) require utilities to generate a certain portion of their electricity from renewable sources, including wind. These requirements vary by state; currently 29 states and Washington D.C. have established renewable portfolio standards and an additional 8 states have non-binding voluntary renewable goals (Figure SC.7). RPS requirements are thought to be the primary driver in U.S. renewable electricity generation since 2000. However, current and future growth in demand for wind energy is expected to be driven primarily by corporate demand given rising capacity factors and decreasing installation costs. More information about renewable portfolio standards is available on National Conference of State Legislatures website.
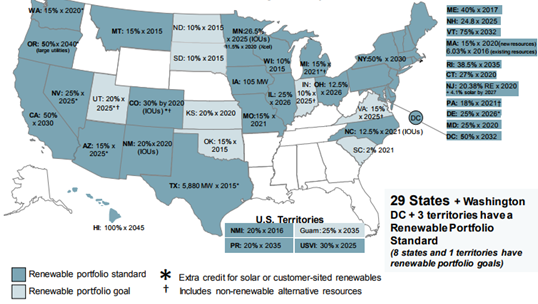
Figure SC.7 Nationwide Renewable Portfolio Standard Policies
Source: DSIRE database, www.desireusa.org
Renewable Energy Credits (RECs)
Renewable Energy Credits (RECs), also known as Renewable Energy Certificates, or Renewable Electricity Certificates, were first created as a means to track progress towards and compliance with states’ Renewable Portfolio Standards (RPS). RECs are tradable, non-tangible energy commodities that represent the environmental benefits associated with one megawatt-hour (MWh) of electricity generated from renewable sources. The REC mechanism is designed to incentivize carbon-neutral renewable energy by providing a production subsidy to electricity generated from renewable sources.
Power Purchase Agreements (PPAs)
The power purchase agreement (PPA) is one of the key contracts for a large onshore wind project, in which a power off-taker that specifies the terms under which electricity produced at the wind project will be sold. A PPA is fundamental to obtaining financing because it details the expected long-term revenue for the project. Wind power PPA prices, especially in the U.S. interior region, have been competitive with the projected gas prices since 2009.
Long-term PPA is still the preferred wind purchasing mechanism for utility and non-utility customers. However, in recent years, select utilities have preferred to directly own wind projects, and at least 22% of utility-procured wind power capacity built since 2008 are under direct utility ownership. The Energy Policy Act of 2005 defines projects that may employ PPAs, and most PPAs are subject to regulation by the Federal Energy Regulatory Commission (FERC).
Expedited Permitting and Interconnection Process
In the U.S., permits are required at the local, state, and federal levels to construct and operate wind projects and to sell the electricity produced. Typically, a wind project needs approval from a local land use board or zoning authority, a building permit, an electrical permit, and in some cases, a permit from the fire department. Most states establish statewide wind siting requirements and guidelines to make sure there is uniformity to the siting process through either state government or local jurisdictions. Wind projects located on federal lands may require permits from the BLM or the Department of Agriculture’s Forest Services. Because utility-scale wind projects usually sell the electricity they generate to wholesale utility buyers, interconnection agreements are required, often including additional facilities and transmission infrastructure upgrades to ensure the grid stability. The BLM’s Competitive Leasing Rule for Solar and Wind Energy Development, effective January 2017, is expected to decrease the timeframe of obtaining a renewable energy project permit on federal lands by one half; it establishes a competitive bidding process to attract renewables development on federal lands, drawing from the process used to award oil and gas extraction leases.
Modified Accelerated Cost-Recovery System (MACRS)
The Modified Accelerated Cost Recovery System (MACRS), which was initially established in 1986, alters the computation of depreciation on renewable generation equipment in order to boost cost recovery through tax deductions for project owners. MACRS allows full depreciation of qualifying wind generation equipment over the first five years of the project, which provides a tax benefit sooner than traditionally allowed for annual depreciation. Unlike utility-scale PV and small wind generators (<100 kW), utility-scale wind is not currently eligible for any bonus depreciation.
Quantitative Measures of Imperfect Competition
Four Firm Concentration Ratio (FFCR)
This information is not available from the U.S. Census for construction and several other activities encompassed by the roles of project developers and EPC firms. However, the HHI, addressed below, is a more nuanced metric than the FFCR.
Herfindahl-Hirschman Index (HHI)
Based on data on wind project construction in 2016, the HHI for wind project developers across the U.S. is approximately 1,160 (Table SC.3). However, as many project developers and EPC firms concentrate their activities to certain regions, the actual market concentration in a given geography is likely somewhat higher than this calculation suggests. For example, within this same dataset, focusing on wind project development in Texas leads to an estimated HHI of 1,631 (Table SC.4).
Table SC.3 Top U.S. Wind Project Developers by Installed Capacity (2017)
Source: Calculated from Appendix A of American Wind Energy Association 2017 U.S. Wind Industry Market Report
| Project Developer | Installed Capacity (MW) |
Number of Projects |
Share of Installed Capacity |
| Enel Green Power North America | 1247.05 | 5 | 17.8% |
| Tradewind Energy | 1247.05 | 5 | 17.8% |
| Avangrid Renewables | 611.2 | 4 | 8.7% |
| Infinity Wind Power | 580.65 | 3 | 8.3% |
| E.ON Climate & Renewables | 533.8 | 2 | 7.6% |
| Lincoln Clean Energy | 503 | 2 | 7.2% |
| Apex Clean Energy | 450.675 | 3 | 6.4% |
| EDP Renewables North America LLC | 363.1 | 4 | 5.2% |
| NextEra Energy Resources | 354.91 | 4 | 5.1% |
| EDF Renewable Energy | 354.575 | 2 | 5.1% |
| Tri Global Energy | 352.05 | 2 | 5.0% |
| MidAmerican Energy | 334 | 2 | 4.8% |
| National Renewable Solutions | 324.3 | 3 | 4.6% |
| Pattern Energy Group LP | 324.3 | 3 | 4.6% |
| Invenergy | 276 | 1 | 3.9% |
| Orion Energy | 276 | 1 | 3.9% |
| RES Americas | 215 | 2 | 3.1% |
Note (1): Full wind project capacity credit is given to developers, even if multiple developers participated in the development process. Share of installed capacity is calculated by dividing the installed capacity by the total wind capacity installed in 2017 (7,023 MW).
Note (2): Only project developers with installed capacity greater than 3% are listed in the table.
Table SC.4 Top Texas Wind Project Developers by Installed Capacity (2017)
Source: Calculated from Appendix A of American Wind Energy Association 2017 U.S. Wind Industry Market Report
| Project Developer | Installed Capacity (MW) | Number of Projects | Share of Installed Capacity |
| Lincoln Clean Energy | 503.0 | 2 | 21.82% |
| Apex Clean Energy | 450.7 | 3 | 19.55% |
| Tri Global Energy | 352.1 | 2 | 15.27% |
| Invenergy | 276.0 | 1 | 11.97% |
| Orion Energy | 276.0 | 1 | 11.97% |
| E.ON Climate & Renewables | 228.0 | 1 | 9.89% |
| WindHQ | 163.2 | 1 | 7.08% |
| Akuo Energy USA | 149.3 | 1 | 6.48% |
| Infinity Wind Power | 100.1 | 1 | 4.34% |
| NRG Energy | 100.1 | 1 | 4.34% |
| National Renewable Solutions | 82.8 | 1 | 3.59% |
| Pattern Energy Group LP | 82.8 | 1 | 3.59% |
Figures SC.7 and Figure SC.8 present similar information on the shares of capacity and total number of projects completed by major EPC firms; these data sources suggest HHI scores of approximately 1,140 and 1,320 for U.S. EPC firms, respectively.
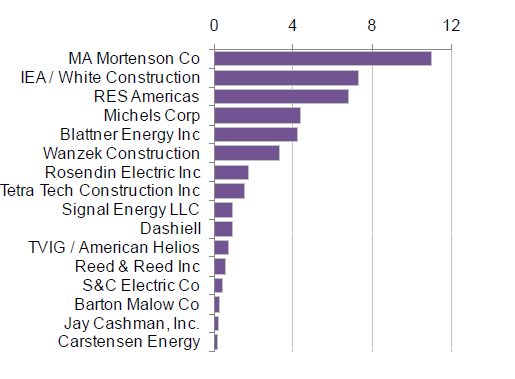
Figure SC.8 Top U.S. Wind EPC Companies (GW of projects operational or in development)
Source: Figure 9 from Bloomberg New Energy Finance (2014) The Evolving Landscape for EPCs in U.S. Renewables. Original data from company websites.
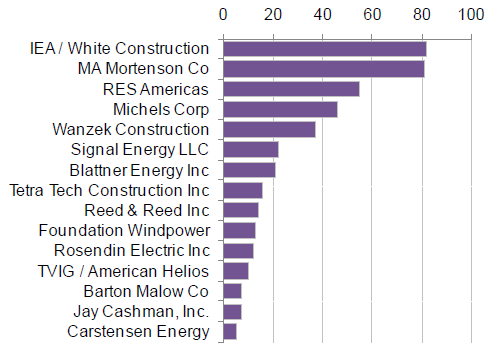
Figure SC.9 Top U.S. Wind EPC Companies (number of projects operational or in development)
Source: Figure 11 from Bloomberg New Energy Finance (2014) The Evolving Landscape for EPCs in U.S. Renewables. Original data from company websites.
Firm Economic Data Table
Table SC.5 and Table SC.6 list firm revenues, number of employees, as well as location of headquarter and manufacturing facilities. More detailed firm information can be found in their annual report or company website (link provided).
Table SC.5 Detailed Economic Data for Major Wind Project Developers in the U.S.
Source: Compiled by authors based on company’s annual financial report or online website
Table SC.6 Detailed Economic Data for Major EPC Firms in U.S. Wind Industry
Source: Compiled by authors based on company’s annual financial report or online website