Direction and Rate of Technological Change
The innovative outcomes in this value chain step encompass the decreasing soft costs associated with onshore wind project development and EPC, as well as decreasing development timeline through more streamlined administrative procedures. In general, the total cost reduction potential remains significant for the global wind industry, with costs projected to fall from around $1,560/kW in 2015 to $1,370/kW in 2025. As shown in Figure IO.1, wind towers and turbines are the two main drivers of potential cost reductions, projected to account for 29% and 27%, respectively, of the total reduction in the global weighted average installed cost of onshore wind projects between 2015 and 2025. Yet, the increased application of best practices by project developers and regulators during the project development stage could yield around 25% of the total cost reduction.
Other relevant innovations include the technological advancement of wind turbines through higher rated turbines, rotor diameters and hub height that increases wind power generation from the same or lower wind resource, and improved turbine reliability and operation and maintenance (O&M) best practices. The first three factors are primarily relevant to the technological innovation embedded in the wind turbines—they are discussed in detail in the “Turbine Manufacturing” step of the value chain. There is a clear trend of reduced O&M costs as technologies have advanced in recent years; however, it is difficult to accurately predict future O&M cost reduction potential as these cost data are hard to obtain. Wind project owners or operators can now apply advanced meteorological and fatigue modeling software to monitor wind turbine operational performance and to better manage the servicing of wind turbines.
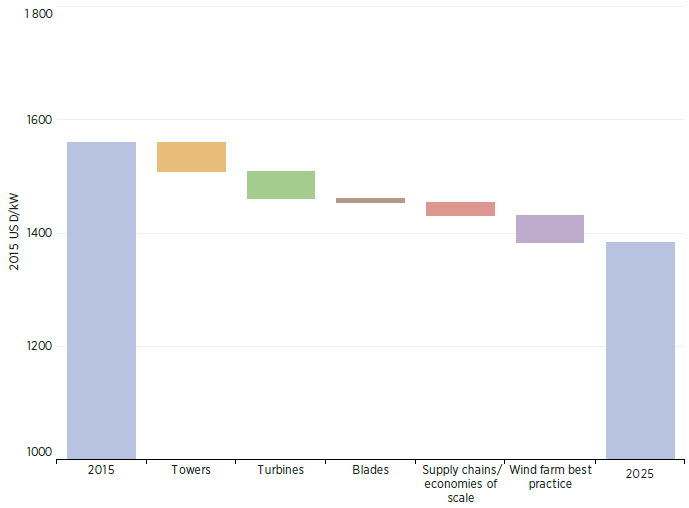
Figure IO.1 Total Installed Cost Reduction for Onshore Wind by Source, 2015-2025
Source: Figure 24 from IRENA (2016) The Power to Change: Solar and Wind Cost Reduction Potential to 2025. Original data from MAKE Consulting (2015).
Data on Quantity, Cost, Quality
It is less obvious how one would construct a learning curve for project development and EPC as compared to a technological commodity like a turbine blade. However, we propose several data types that can shed light on advancements in this sector. For a turbine blade, “quality” includes things such as weight, material, and expected functional lifetime; for process- and procedure-driven sectors like project development and EPC, one important “quality” is the efficient use of time. Data that will be valuable for future research into the value of innovations in project development and EPC include:
- Time series of the quantity of wind projects completed (ideally number of installations, but installed capacity could be useful as well)
- Time series of various project development and EPC costs, particularly types of soft cost (see, e.g., “wind farm best practice” Figure IO.1)
- Time series of average time-to-completion for a benchmark-sized utility-scale wind project
- Time series of average time to obtain permits, PPAs, and project financing