Market Structure
The growing share of BOS in the total cost of utility-scale solar systems has direct implications on its competitiveness. BOS had been an area that received very limited research attention compared with PV modules, but this is changing slowly due to its growing cost reduction potential. (Elshurafa et al. 2018) Market players throughout the solar value chain are constantly seeking cost saving opportunities; hence, as the industry matures globally and competition increases within markets, the supply chain margins will likely decrease, as profit and other overhead charges made by suppliers, manufacturers, distributors and retailers declines. (IRENA 2016)
Porter’s Five Forces
In this section, we explore Porter’s five forces in PV BOS manufacturing; specifically, these are: the threat of new entrants, the threat of established rivals, the threat of substitute products or services, the bargaining power of suppliers, and the bargaining power of buyers. The framework is illustrated in Figure SC.1 below and characteristics of each of the forces will be discussed in detail subsequently in the context of PV BOS manufacturing.
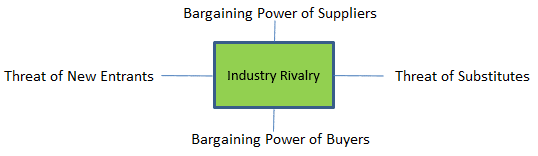
Figure SC.1 Porter’s Five Forces
- Industry Rivalry:
As compared to the PV module market, the solar BOS market is currently less competitive. However, module commoditization leaves companies looking at BOS to differentiate themselves. Competition in the solar BOS market is growing as the size of the market increases rapidly, and companies face increased pressures from declining prices. According to GTM Research, the BOS market is fragmented, and shifting demand and failing prices will result in increased market consolidation.
- Threat of New Entrants:
Solar inverters have become highly sophisticated with features like optimization and monitoring, so there is some degree of technical barrier for new comers in the inverter industry. However, the overall barriers to entry are relatively low compared to the PV module industry.
In the past, solar mounting companies had highly differentiated intellectual properties, and consequently had high barriers to entry. A series of product innovations allowing for cost decreases led to pressure to lower prices, and IP differentiation is now minimal and barriers to entry are low.
- Threat of Substitute:
Inverters, along with other BOS components, are a crucial part of the entire PV system. The BOS system as a whole face very low threat of substitute, but each component may experience the threat of substitution among technology types (e.g., central inverter versus micro-inverter).
- Bargaining Power of Suppliers
The manufacturing of BOS equipment is largely a commodity market; they rely heavily on commodity products purchased from competitive companies with limited bargaining power.
- Bargaining Power of Buyers
Reliability and efficiency are what project developers and engineering, procurement and construction (EPC) contractors look for besides costs when selecting which BOS components to put in their project. As more Chinese companies enter the market, the competition is growing and the industry is facing higher bargaining power of buyers.
Vertical Integration
Many module manufacturers also manufacture their own range of inverters and/or offer electrical components as part of a module package. Vertical integration can enable manufacturers to better compete for customers. For example, in addition to offering solar panels, First Solar also offers integrated solutions, such as project development and engineering design for customers. By providing value added services, manufacturers become a time-saving “one-stop-shop” for downstream customers. (IBISWorld 2017)
Overview of Geography
As mentioned in the Solar Module step, location is intrinsically tied to a manufacturer’s ability to exert power in a mature and globalized industry. Even though the PV BOS market is less mature than that of PV modules, growing maturity and competition suggest that strategic siting of manufacturing facilities will be crucial for becoming competitive and maintaining a competitive advantage in the solar BOS industry. More extensive discussion regarding the competitive landscape and major firm locations for inverters and racking is provided below.
Inverters
According to GTM Research’s report, the global PV inverter market concentration continues to grow as the market matures. GTM Research stated that the top twenty solar inverter suppliers account for 93% of global shipment in 2017, and the top five of these players constituted more than 50% of the total shipments. Europe used to dominate the global inverter market, but the global market shares of Chinese companies (e.g.., Huawei and Sungrow) has grown in recent years, largely due to low cost advantages and ready access to the world’s largest market for solar in China. Table SC.1 lists the top ten global PV inverter suppliers and their market shares by shipments in 2017.
Table SC.1 Top 10 Global PV Inverter Suppliers in 2017
Source: PV Europe https://www.pveurope.eu/News/Solar-Generator/Solar-inverter-ranking-Huawei-Sungrow-and-SMA-leading (based on GTM Research’s The Global PV Inverter and MLPE Landscape: H1 2018)
| Ranking | Company | Market Share |
| 1 | Huawei Technologies | 26.4% |
| 2 | Sungrow Power Supply | 16.7% |
| 3 | SMA Solar Technology AG | 8.7% |
| 4 | ABB | 5.6% |
| 5 | Sineng Electric Co. | 4.6% |
| 6 | TBEA SunOasis | 3.9% |
| 7 | Power Electronics | 2.9% |
| 8 | TMEIC | 2.8% |
| 9 | Schneider Electric | 2.6% |
| 10 | SolarEdge Technologies | 2.5% |
Racking
PV trackers are projected to be the fastest growing solar racking segment through 2022, driven by falling costs, technology improvements and geographic diversification. The share of trackers among ground mount solar projects is projected to increase to 42 percent by 2023 (GTM Research 2018). The U.S. accounted for 70% of tracker installations in recent years, but is expected to drop to 25% by 2022 due to new entrants from Asia and increasing demand from Middle East, Latin American and Africa (GTM Research, 2017). Table SC.2 lists the top ten global PV tracker suppliers by shipment in 2017 which is largely composed of US companies, and their corresponding market shares.
Table SC.2 Top 10 Global PV Tracker Suppliers by Shipment in 2017
Source: GTM Research 2018
| Ranking | Company | Market Share | HQ Location |
| 1 | Nextracker | 33% | USA |
| 2 | Array Technologies | 14% | USA |
| 3 | Soltec | 7% | USA |
| 4 | Arctech Solar | 6% | Italy |
| 5 | Convert Italia | 5% | USA |
| 6 | PV Hardware | 5% | USA |
| 7 | Sti Norland | 5% | USA |
| 8 | NClave | 4% | Spain |
| 9 | Ideematec | 3% | USA |
| 10 | Solar Steel | 3% | USA |
NEXTracker and Array Technologies collectively accounted for nearly half of the global tracker market in terms of product shipments in 2017. NEXTracker supplied the most distributed systems and Array Technologies supplied the most centralized systems. There are also vertically integrated solar companies who manufacture trackers, such as SunPower.
Figure SC.2 categorizes top global tracker suppliers by the degree of vertical integration and tracker sub-type. Figure SC.3 shows the detailed breakdown of PV BOS costs by country in 2015.
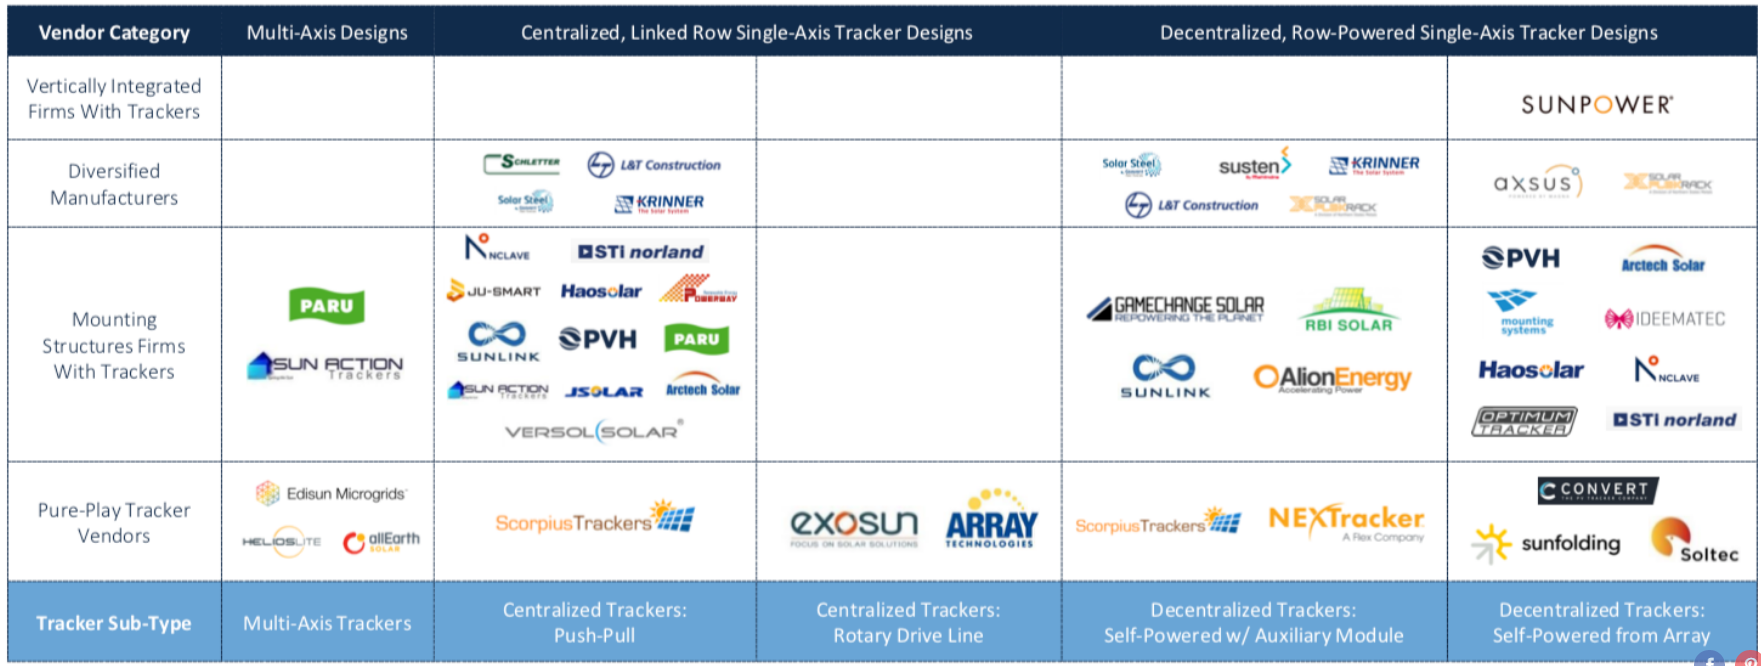
Figure SC.2 Global PV Tracker Vendor Taxonomy 2017
Source: GTM Research 2018
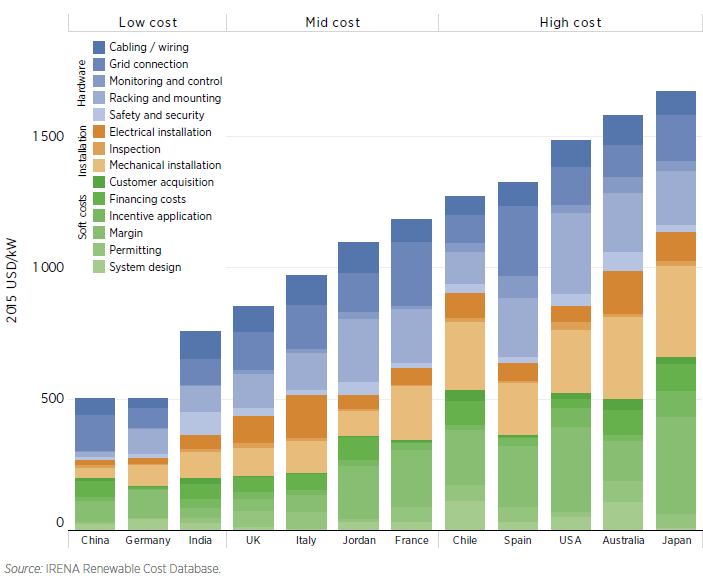
Figure SC.3 Detailed Breakdown of Solar PV BOS Costs by Country, 2015
Source: Figure 2 from IRENA 2016, original data from IRENA Renewable Cost Database
Overview of Governance
Government policies that affect the PV module industry should have impact on solar BOS industry, though in some cases to a lesser degree because some BOS suppliers are diversified and have business revenue from other sectors. Please refer to the Solar Module step for more details on overview of governance.
Tariffs imposed on raw material used in solar projects are likely to impact the solar industry. For instance, recently proposed U.S. steel and aluminum tariffs are expected to add additional cost to utility-scale solar project if approved. The utility- scale solar market is particularly sensitive to new tariffs, as BOS components that use raw material account for a larger portion of the overall project costs. A study indicates that such tariffs could cause an additional 2 to 4 cents per watt increase in the price of racking. (GTM 2018)
Quantitative Measurement of Imperfect Competition
Four Firm Concentration Ratio (FFCR)
“All Other Miscellaneous Electrical Equipment and Component Manufacturing” (NAICS 335999) is the closest six-digit code industry that covers components used in PV BOS. Note that this industry code also includes a range of components, products or services other than PV BOS manufacturing. Table SC.3 details the data used to calculate the FFCR for PV BOS manufacturing.
Table SC.3 FFCR for All Other Miscellaneous Electrical Equipment and Component Manufacturing (NAICS 335999)
Source: 2012 U.S. Economic Census, Manufacturing: Subject Series: Concentration Ratios: Share of Value of Shipments Accounted for by the 4, 8, 20, and 50 Largest Companies for Industries: 2012
| Year | Firms | Number of Companies | Number of Establishments | Number of Employees | Total Value of Shipments ($1,000) | % of total Value of Shipments and receipts for services | % of Value of Shipment by the HHI for 50 Largest companies (%) |
| 2012 | All firms | 823 | $5,393549 | 100.0 | |||
| 2012 | 4 largest firms | 19.6 | |||||
| 2012 | 8 largest firms | 30.0 | |||||
| 2012 | 20 largest firms | 46.4 | |||||
| 2012 | 50 largest firms | 66.3 | 167.7 |
Firm Economic Data Table
Table SC.4 and Table SC.5 list firm revenues, number of employees, as well as location of headquarter and manufacturing facilities for leading global PV inverter and tracker suppliers. More detailed firm information can be found in their annual report or company website (link provided)
Table SC.4 Key Financial Metrics of Leading PV Inverter Suppliers
Source: Compiled by authors based on company’s annual financial report, online website or other media outlets
| Company Name | Headquarter Location | Manufacturing Locations | Number of Employees | Revenue (USD $million) | Source/ Note |
| Huawei Technologies | China | China | 180,000 | 92,549 | 2017 Annual Report |
| Sungrow Power Supply | China | China, India | 800 | n/a | Company Website |
| SMA Solar Technology AG | Germany | Germany | 3,213 | 1,042.80 | 2017 Annual Report |
| ABB | Switzerland | 134,800 | 34,312 | 2017 Annual Report | |
| Sineng Electric Co. | China | China | n/a | n/a | Company Website |
| TBEA SunOasis | China | China | 3300 | 246.2 (first half of 2017) | 2017 Interim Report |
| Power Electronics | Spain | 1,300 | n/a | Company Website | |
| TMEIC | Japan | Japan, China, USA, Thailand | ~2,000 | n/a | Company Website |
| Schneider Electric | France | 142,000 | 28,909 | Company Website | |
| SolarEdge Technologies | Israel | 1,007 | 189.34 | Form 10-K |
Table SC.5 Key Financial Metrics of Leading PV Tracker Suppliers
Source: Compiled by authors based on company’s annual financial report, online website or other media outlets
| Company Name | Headquarter Location | Manufacturing Locations | Number of Employees | Revenue (USD $million)* | Source/ Note |
| Nextracker | USA | USA, India, China, Brazil, Mexico, Spain | 200,000 | n/a | Company Website |
| Array Technologies | USA | USA | 51-200 | n/a | Company Website |
| Soltec | Spain | Spain | 501-1,000 | n/a | Company Website |
| Arctech Solar | China | China | 501-1,001 | n/a | Company Website |
| Convert Italia | Italy | Italy | 51-200 | n/a | Company Website |
| PV Hardware | Spain | Spain | n/a | n/a | Company Website |
| STI norland | Spain | Spain, Brazil | 51-200 | n/a | Company Website |
| NClave | Spain | Spain, Argentina, Brazil, Mexico | 51-200 | n/a | Company Website |
| Ideematec | Germany | Germany, USA, Mexico, Chile, Brazil | 51-201 | n/a | Company Website |
| Solar Steel | Spain | Spain, Colombia, Turkey | n/a | n/a | Company Website |
*All of the leading PV tracker suppliers listed here are privately held companies, so it is difficult to obtain company financial data as they are not required to disclose them.