Market structure
The market structure, in terms of competitiveness, specialization, location, etc., differs across the value chain steps encapsulated within PV module manufacturing (i.e., materials processing, wafer production, etc.). Upstream materials processing activities require high capital investment and technological precision, resulting in few polysilicon and wafer producers with high market share, geographically concentrated around knowledge hubs; downstream manufacturing activities, such as module assembly, tend to have lower barriers to entry and are sited near low-cost labor.
Silicon Market
Polycrystalline and monocrystalline silicon manufacturers are impacted by the availability and cost of silicon (see, e.g., Bloomberg Reports 2017). Between 2010 and 2017, the U.S. share of global polysilicon production fell from 29.1% to 11.3%; China now accounts for approximately 70% of global production. In recent years, the top five polysilicon producers have represented approximately 60% of total output (Figure SC.4).
![]()
Figure SC.1 Top Five Polysilicon Manufacturers 2015-2017
Source: PV Magazine, “Polysilicon and Wafer Ranking 2016”
Wafer Market
There is a shift under way from polycrystalline silicon wafers to monocrystalline silicon wafers, as technology improvements have decreased the cost of monocrystalline silicon. Leading wafer manufacturers are acquiring additional facilities and otherwise increasing manufacturing capacity in order to ramp up production of monocrystalline silicon wafers. Figure SC.2 shows the production of the top ten wafer manufacturers. Xi’an Longi Silicon Material Corporation is the leading producer of monocrystalline silicon; GCL-Poly Energy has traditionally focused on polycrystalline, but has announced plans to increase monocrystalline capacity.
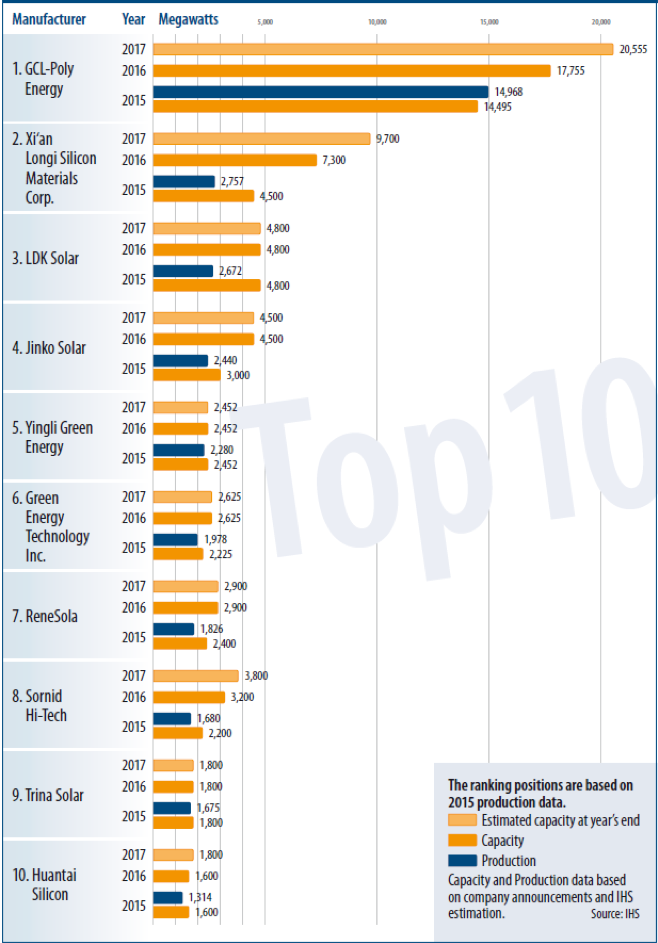
Figure SC.2 Top Ten Wafer Manufacturers 2015-2017
Source: PV Magazine, “Polysilicon and Wafer Ranking 2016”
PV Module Market
Currently, Chinese manufacturers dominate the global market for PV, particularly in crystalline silicon modules. In 2018, seven of the top ten solar manufacturers were headquartered in China. Strong demand for PV, policy conditions, labor supply, local economic development pressure, and technology transfer from related industries have all contributed to China’s current dominance in this industry.
U.S. capacity for PV cell and module production currently lags behind demand, leaving the U.S. a net importer of solar products. Low prices driven by competition from imports have played a role in discouraging U.S. production. Among U.S. based manufacturers, many locate the bulk of their production facilities outside of the U.S. U.S. PV module production tends to focus on technological differentiation (e.g., thin film, high-efficiency silicon based modules, etc.), rather than competing based on cost in the market for traditional polysilicon modules. It is evidenced by the greater number of thin-film startups and the higher share (~30%) of thin-film production in the U.S. relative to crystalline production than in Europe or Asia.
Porter’s Five Forces
In this section, we begin by exploring Porter’s five forces in PV module manufacturing; specifically, these are: the threat of new entrants, the threat of established rivals, the threat of substitute products or services, the bargaining power of suppliers, and the bargaining power of buyers. The framework is illustrated in Figure SC.3 below and characteristics of each of the forces will be discussed in detail subsequently in the context of PV module manufacturing.

Figure SC.3 Porter’s Five Forces
- Industry Rivalry:
In recent years, competition in PV module manufacturing has increased due to significant structural pressure from falling prices and diminishing margins. The large number of competing firms also contributes to high industry rivalry. Counterbalancing some recent industry consolidation, more companies have entered the industry as prospective module suppliers, predominantly from China, than have exited the industry through acquisition. The solar industry in general also faces fierce competition from low cost substitute electricity-generating sources, such as conventional fossil fuels. In order to ultimately achieve grid parity with other generating sources, there is an implicit price limit for all products and services along the value chain. This cost pressure contributes to the degree of competition in the industry. Solar module quality is another basis for competition, as high-quality and high-efficiency modules can generate more electricity, which reduces the per-watt cost.
- Threat of New Entrants:
When looking at the sub-activities in PV module manufacturing (e.g., silicon processing, wafer production, etc.), the level of threat posed by new entrants can differ substantially depending on technological complexity and capital requirements. Figure SC.4 suggests that the threat of new entrants becomes more severe moving down the solar value chain, as there are more competing companies in later steps. Broadly speaking, the initial materials processing steps are technologically intensive, creating a relatively high market barrier and resulting in few companies conducting such activities. It is estimated that the top five polysilicon producers accounted for 55% to 60% of global market share in 2016. Module assembly is a comparatively simple process and requires lower initial investment to operate facilities resulting in low market barrier; hence, there are significantly greater number of global payers involved in module manufacturing. For those steps in the middle, wafer producers usually have long-term contracts with polysilicon suppliers, which makes it difficult for new entrants. The wafer industry is dominated by five companies accounting for over two thirds of the total market and many small companies contributing a low volume of production. The PV cell industry has relatively lower market barriers, but it still requires significant capital investment to reach economy of scale. The top 10 PV cell manufacturers produced less than 50% of the total market in 2015.
![]()
Figure SC.4 Crystalline Silicon Solar Value Chain
Source: The California Solar Energy Cluster, original data from Barclays Capital (2010)
Note: The company list may be outdated but the level of competition determined by the number of companies in each step remain relatively the same as of today.
Thin-film modules take fewer steps to make and the process is less complicated compared to crystalline silicon, so there are fewer barriers to develop a small-scale production (see Figure SC.5 for the relative shares of module production by PV technology type). Recently, R&D efforts have focused on thin-film technologies, leading to a diverse mix of players including start-up companies, universities and research institutes. However, in later stages of market development, when economies of scale become critical to achieve cost competitiveness, gaining the access to capital may become difficult and create barriers for new entrants.

Figure SC.5 U.S. Module production by technology type (2016)
Source: Figure 2.40 from SEIA U.S. Solar Market Insight 2016 Year in Review
- Threat of Substitutes:
Overall, potential substitutes for solar energy include other renewable energy sources (e.g., wind, hydro, geothermal, and biofuel) and traditional carbon-intensive fossil fuel options. As the levelized cost of energy (LCOE) from wind power source continues to decline following government support and technology innovation, solar energy faces strong competition with wind energy in particular, among renewables. In recent years, low U.S. natural gas prices have contributed to an increase in natural gas power, which has displaced a great amount of coal-fired energy generation and may pose a competitive threat to the expansion of solar power if its price remains low. Among solar energy, a variety of solar technologies are constantly competing with each other in terms of price and energy efficiency.
At each value chain step within solar module manufacturing, the threat of substitutes can be very different. There is virtually no threat of substitution for polysilicon production and wafer manufacturing as long as there is a demand for silicon wafers for chip and solar cell manufacturers. The only potential threat to polysilicon production is thin-film solar technologies. However, since on average thin-film technologies are not as efficient as wafer-based PV technologies, thin-film is not a perfect substitute for polysilicon, especially when space is a constraint.
- Bargaining Power of Suppliers:
Recent demand for both polysilicon and monocrystalline silicon has been strong given the increase in installation in China. This allows polysilicon suppliers to have strong bargaining position. The need for reliable suppliers and buyers has stimulated considerable vertical integration, and encouraged partnerships and long-term agreements.
The bargaining power of suppliers decreases when an industry can control their suppliers either by acquiring them (i.e., through vertical integration) or by negotiating long-term commitments. The solar module manufacturing industry has experienced a shift to vertical integration in the past few years, resulting in better control of the entire manufacturing process, especially through the component manufacturing steps of the value chain. Vertical integration can also prevent delivery delay of the final product. For cell manufacturing, very few companies are purely cell manufacturers; most of them are either backward- or forward-integrated with wafer and/or module manufacturing. The aim of this vertical integration is to form strategic partnerships that can help differentiate a company’s competitive positioning and develop better access to target customers. Some of the large cell manufacturers, like SolarWorld and Suntech, are integrated with module manufacturing and do not sell their cells separately, limiting the choice for module manufacturers who do not have this kind of strategic partnership with cell manufacturers.
Susman et al. (2009) categorized top PV cell manufacturers into four strategic groups based on their target market and degree of vertical integration: (1) companies that are integrated across six or seven supply chain sets (i.e., polysilicon and/or wafer, cell, module to systems and/or distribution), like SolarWorld, (2) companies that are integrated across from wafer to modules, (3) companies that are highly integrated and mainly focus on large scale utility and commercial projects, such as First Solar and SunPower, and (4) companies that are “pure player” cell manufactures who sell their cells to solar module OEMs, such as Q-Cells.
The main suppliers of thin-film modules are chemical companies that produce high quality material such as CdTe, CIS/CIGS, etc. These chemical components used in thin-film modules are less constrained than polysilicon used in silicon-based modules. Thus, suppliers of thin-film modules have relatively lower bargaining power.
- Bargaining Power of Buyers:
As the wholesale distribution of solar modules is fragmented with few global players, the bargaining power of module buyers is not especially strong. When looking at each value chain step within solar module manufacturing, some big polysilicon producers are now forward-integrated into wafer manufacturing because the process of ingot growing and wafer cutting is now largely standardized.
Overview of Geography
Modern manufacturing is globalized and routinized. Location is intrinsically tied to a manufacturer’s ability to exert power in an interconnected global market. Regions and countries compete intensely to attract energy technology manufacturing through supportive government policies and protect domestic production through safeguard trade tariffs. Proximity of suppliers and buyers, favorability of policies, availability of affordable and skilled labor, and the presence or absence of strong rivals all impact the degree to which a manufacturer will be able to thrive in a given location. Strategic siting of manufacturing facilities is crucial to becoming and remaining competitive in the solar industry. In this section, we discuss the locations of PV module manufacturing across the world, including shifts in the dominant regions of production over time. In the next section, we provide greater detail on the policy environments that contribute to the appeal of manufacturing in one region of country versus another.
Global Production of PV Modules
Currently, Chinese manufacturers dominate the global market for PV, particularly in crystalline silicon modules. In 2018, seven of the top ten solar manufacturers were headquartered in China (Table SC.1). Strong demand for PV, policy conditions, labor supply, local economic development pressure, and technology transfer from related industries have all contributed to China’s current dominance in this industry. In response to import tariffs imposed by the U.S. and elsewhere, several major Chinese manufacturers have begun to add new module and cell manufacturing capacity outside of China. For example, JinkoSolar, currently the global top PV module manufacturer, plans to invest $50 million over the next four years to expand PV manufacturing in Florida. Manufacturing capacity is currently expanding in Thailand, Vietnam, Malaysia, Korea, Japan, Indonesia, Brazil, South Africa, India, Turkey, Dubai, Germany, the Netherlands, Portugal, Russia, and Canada.
Table SC.1 Top 10 Solar Panel Manufacturers in 2018 (Global)
Source: Energysage website https://news.energysage.com/best-solar-panel-manufacturers-usa/, with added column “Production Locations”
| Rank | Company | Headquarters | Production Locations |
| 1 | JinkoSolar | China | China, Malaysia |
| 2 | Trina Solar | China | China |
| 3 | Canadian Solar | Canada | Canada, China, Indonesia, Vietnam and Brazil |
| 4 | JA Solar | China | China |
| 5 | Hanwha Q CELLS | South Korea | China, Malaysia and South Korea |
| 6 | GCL-SI | Hong Kong | China |
| 7 | LONGi Solar | China | China, India, Malaysia |
| 8 | Risen Energy | China | China |
| 9 | Shunfeng | China | China |
| 10 | Yingli Green | China | China |
Note: Many of these companies are vertically integrated to some degree, manufacturing wafers and/or cells as well as PV modules.
Figure SC.6 Global Polysilicon Production Capacity and Share by Region
Source: Figure 6 from NREL (2016) On the Path to SunShot: Emerging Opportunities and Challenges in U.S. Solar Manufacturing, original data from ENF 2013, BNEF Desktop Portal 2015, and NREL estimates
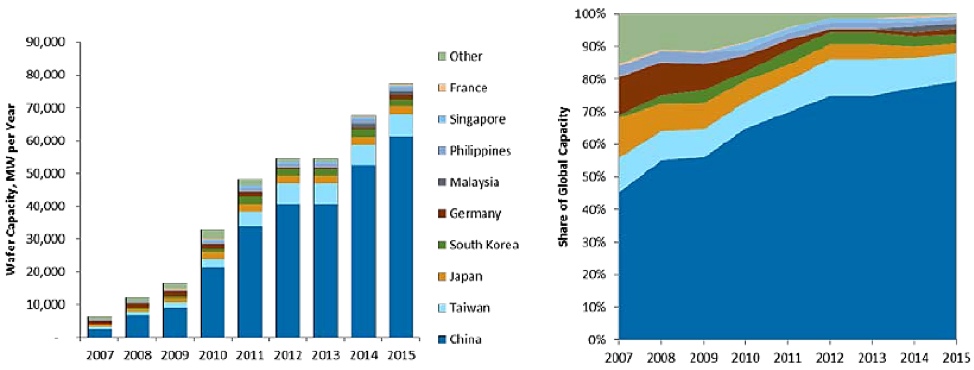
Figure SC.7 Global Wafer Production Capacity and Share by Region
Source: Figure 7 from NREL (2016) On the Path to SunShot: Emerging Opportunities and Challenges in U.S. Solar Manufacturing, original data from ENF 2013, BNEF Desktop Portal 2015, and NREL estimates
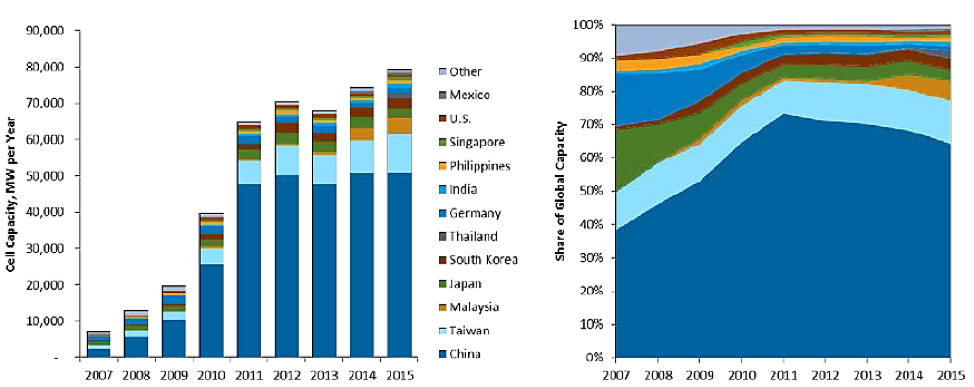
Figure SC.8 Global PV Cell Production Capacity and Share by Region
Source: Figure 8 from NREL (2016) On the Path to SunShot: Emerging Opportunities and Challenges in U.S. Solar Manufacturing, original data from ENF 2013, BNEF Desktop Portal 2015, and NREL estimates
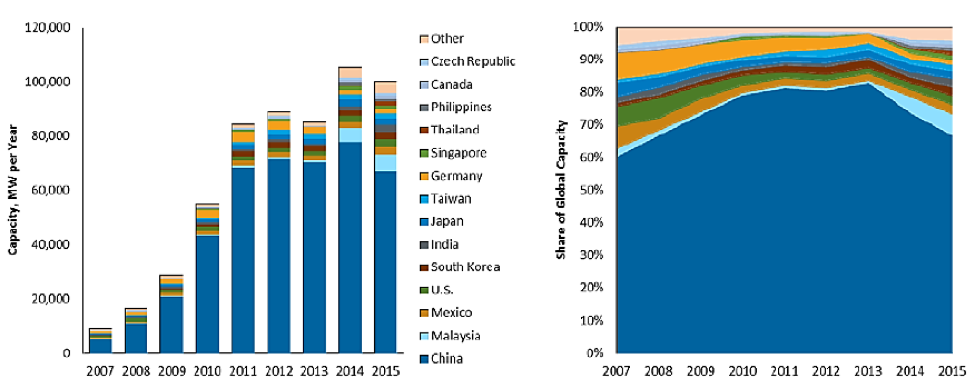
Figure SC.9 Global PV Module Production Capacity and Share by Region
Source: Figure 9 from NREL (2016) On the Path to SunShot: Emerging Opportunities and Challenges in U.S. Solar Manufacturing, original data from ENF 2013, BNEF Desktop Portal 2015, and NREL estimates
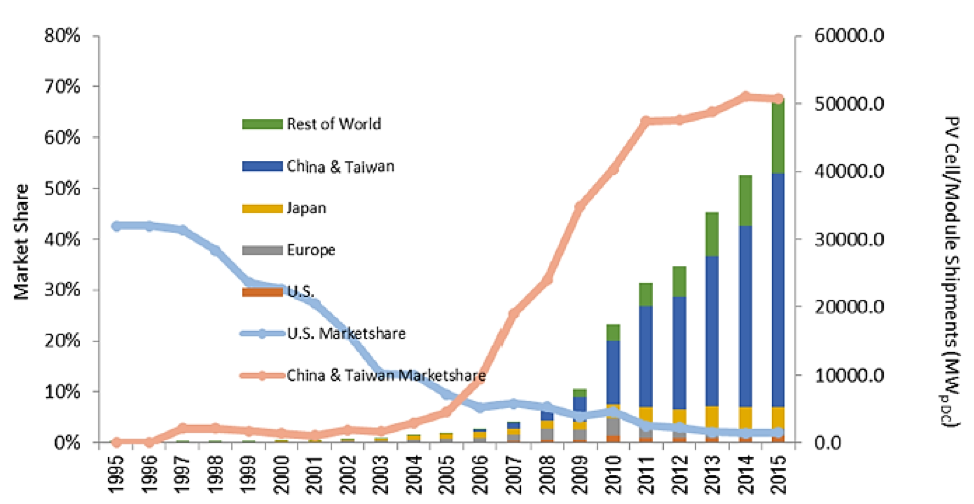
Figure SC.10 Photovoltaic Shipments by Region/Country: 1995-2015
Source: Figure 1 from CEMAC 2017, Energy Innovation Clusters and their Influence on Manufacturing: A Case Study Perspective.
PV Modules in the U.S.
U.S. capacity for PV cell and module production currently lags behind demand, leaving the U.S. a net importer of solar products (IBISWorld). Low prices driven by competition from imports have played a role in discouraging U.S. production. Among U.S. based manufacturers (see Table SC.2), many locate the bulk of their production facilities outside of the U.S. U.S. PV module production tends to focus on technological differentiation (e.g., thin film, high-efficiency silicon based modules, etc.), rather than competing based on cost in the market for traditional polysilicon modules.
Table SC.2 U.S. Solar Panel Manufacturers (2018)
Source: Energysage website https://news.energysage.com/u-s-solar-panel-manufacturers-list-american-made-solar-panels/with minor modifications
| Manufacturer | Location |
| Heliene | Mountain Iron, MN (U.S. manufacturing facility) |
| Itek Energy | Bellingham, WA |
| Mission Solar | San Antonio, TX |
| Seraphim | Jackson, MS (U.S. headquarters) |
| Solaria | Fremont, CA (U.S. headquarters) |
| SolarTech Universal | Riviera Beach, FL |
| SolarWorld Americas | Hillsboro, OR |
| Suniva | Norcross, GA |
| SunSpark | Riverside, CA |
| Tesla/Panasonic | Buffalo, NY (U.S. manufacturing facility) |
| First Solar (thin-film) | Perrysburg, OH (Malaysia and Vietnam) |
| Stion (thin-film) | Hattiesburg, MS |
Unlike crystalline silicon, thin film solar production is dominated by the U.S. and Japan; major players in thin film module manufacturing are described in Table SC.3.
Table SC.3 Main Thin Film Solar Panel Manufacturers
Source: Energysage website https://news.energysage.com/thin-film-solar-panels-make-sense/
| Company | Headquarters | Description |
| First Solar | California U.S.A. | The top thin film manufacturer, First Solar dominates the CdTe technology space. To date, First Solar has only served the commercial market, offering low cost installations at the mass scale for businesses, institutions and solar power plants. Holding the world record for CdTe cell efficiency at 18.7%, this manufacturing behemoth is also offers an impressive 25 year warranty. First Solar TF is also known for its gorgeous aesthetic designs such as their frameless, glass on glass model that boasts increased panel output due to its hyper reflective glass coating. |
| SoloPower | California U.S.A. | The San Jose solar firm is known for versatility and ultra-lightweight design, making it an ideal candidate for building-integrated photovoltaics (where the panel is integrated into a building’s envelope, often along vertical surfaces). SoloPower is one of the world leaders in CIGS manufacturing. |
| Sharp | Japan | Sharp Solar is a global leader in thin film, having been in business for over 50 years, and is the top manufacturer of a-Si technology. The Japanese firm is known for being one of the first innovators in solar cell development and has been contributing to research and development for cell and module efficiency improvements of PV technology since 1959. |
| Solar Frontier | Japan | The world’s top manufacturer for CIGS thin film, Solar Frontier also hails from Japan. This manufacturing giant is partially responsible for the strong forecasted growth for CIGS PV installations worldwide. Solar Frontier’s world record conversion efficiency for TF (22.3%), achieved in 2015, has certainly boosted outlooks. If TF continues to scale in the commercial sector and penetrate the residential market, CIGS will be the technology that can achieve it. Sharp Solar has stated that they have the capability to produce a 30% efficiency CIGS cell – a feat that would revolutionize the concept of thin film solar. |
Note: Besides First Solar and SoloPower listed in the table above, other U.S.-based solar startups, like Ascent Solar (Thornton, CO), Miasolé (Santa Clara, CA) and Uni-Solar (Auburn Hills, MI), invest a lot of R&D in CIGS and triple-junction thin-film productions.
The U.S. represents only a small portion of the total global demand for PV modules; however, certain regions of the U.S. are highly involved in the PV value chain. In particular, California is a knowledge center and innovation hub for the solar industry, with universities, federal laboratories, high-tech firms, and start-ups all contributing to the state’s solid role in the development of third-generation PV technologies. California first became a major center of PV manufacturing in the 1980s, but by 2000, traditional PV manufacturers began to relocate to locations with more favorable policies and less costly labor supplies. Other major PV manufacturing centers in the U.S. include Washington, Oregon, Colorado, Michigan, and Ohio. Figure SC.11 provides a general picture of the PV module value chain within the U.S., including indications of vertical integration within manufacturing stages.
![]()
Figure SC.11 U.S. PV Module, Cell, and Polysilicon Production
Source: Figure 3 from Platzer (2015) U.S. Solar Photovoltaic Manufacturing: Industry Trends, Global Competition, Federal Support, original data from SEIA 2014.
Global PV Installations
Even though low-cost labor is widely perceived as important for attracting manufacturing, the scale of production and an extensive domestic supply chain appear to be more important factors in capital-intensive clean energy technology manufacturing industries. In addition, a 2011 study by the U.S. International Trade Commission (ITC) reported that even the more labor-intensive module assembly process is now being automated, and that module assembly in China and the United States uses similar levels of automation. NREL also estimated that Chinese producers had an inherent cost advantage of no greater than 1% compared with U.S. when considering the imposition of antidumping and countervailing duties in 2012 and 2015.
Given that neither labor costs nor transportation costs (discussed in Knowledge Conditions) are the only decisive factors for selecting manufacturing locations, many manufacturers that opened new facilities over the past decade chose to locate them in countries with strong demand—which generally have been countries with attractive incentives for PV installations. Previously, the primary global markets for PV have been Germany, Italy, Spain, and Japan, and to a lesser extent, other European countries. Following recent reductions in European government support for solar, European demand for PV and European PV manufacturing have both decreased; contemporaneous with sustained or increasing government support of PV manufacturing and generation, PV markets in Japan, China, and other Asian nations have recently been expanding. This pattern is also apparent within the U.S., with PV manufacturing largely mirroring population distributions, solar resources, and proximity to key markets. As of 2017, the Western U.S. was home to approximately 49.7% of PV manufacturing facilities, with the majority of these located in California. Figure SC.12 shows recent utility scale PV capacity additions by state, a pattern that closely matches density of manufacturing facilities. Figure SC.13 shows the distribution of utility-scale solar PV projects across the U.S. and corresponding global horizontal irradiance density.
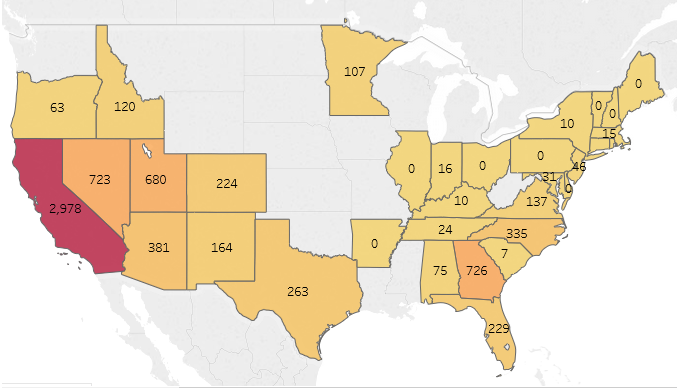
Figure SC.12 Utility Scale PV Capacity Additions in 2016 (Number of projects 2MW or larger)
Source: LBNL 2017 https://emp.lbl.gov/capacity-and-generation-state
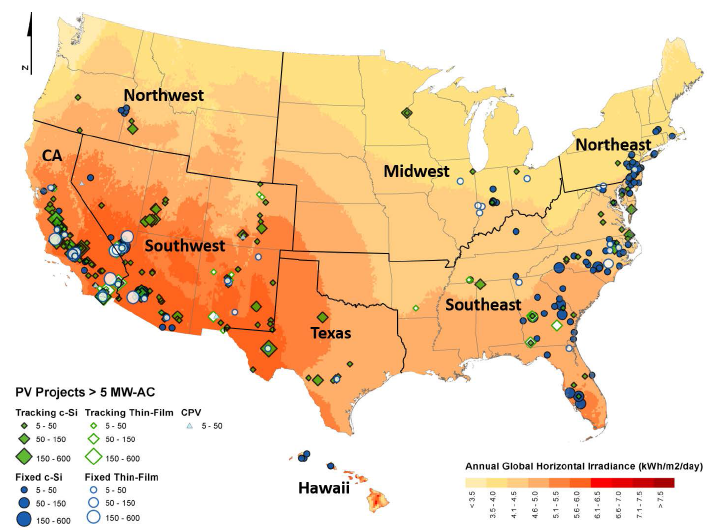
Figure SC.13 Map of Global Horizontal Irradiance and Utility-Scale Solar PV Projects
Source: LBNL (2016) Utility-Scale Solar 2016
Table SC.3 Utility PV Installations by State (MWdc), Q4 2013-Q4 2016
Source: Summarized from Table 2.22 in SEIA U.S. Solar Market Insight 2016 Year in Review
| 2013 Q4 | 2014 | 2015 | 2016 | |
| Alabama | – | 0 | 0 | 102 |
| Arizona | 77 | 103 | 105 | 446 |
| Arkansas | – | 0 | 16 | 0 |
| California | 973 | 2628 | 1857 | 3347 |
| Colorado | – | 0 | 82 | 340 |
| Connecticut | 7 | 7 | 0 | 3 |
| Delaware | 2 | 0 | 0 | 0 |
| Florida | – | 0 | 8 | 370 |
| Georgia | 79 | 42 | 246 | 1018 |
| Hawaii | 6 | 14 | 15 | 7 |
| Idaho | – | 0 | 0 | 221 |
| Illinois | – | 1 | 2 | 0 |
| Indiana | 45 | 56 | 21 | 74 |
| Iowa | – | 0 | 0 | 0 |
| Louisiana | – | 0 | 0 | 0 |
| Maryland | – | 0 | 17 | 16 |
| Massachusetts | 17 | 20 | 0 | 1 |
| Michigan | – | 0 | 1 | 5 |
| Minnesota | – | 0 | 0 | 287 |
| Mississippi | – | 0 | 2 | 7 |
| Missouri | – | 16 | 4 | 3 |
| Montana | – | 0 | 0 | 0 |
| Nevada | – | 318 | 206 | 909 |
| New Hampshire | – | 0 | 0 | 0 |
| New Jersey | – | 77 | 42 | 106 |
| New Mexico | 20 | 67 | 43 | 235 |
| New York | 2 | 10 | 12 | 11 |
| North Carolina | 137 | 389 | 1120 | 907 |
| Ohio | – | 0 | 0 | 4 |
| Oregon | – | 0 | 9 | 125 |
| Pennsylvania | – | 0 | 0 | 0 |
| South Carolina | 3 | 0 | 1 | 61 |
| Tennessee | – | 40 | 1 | 34 |
| Texas | 60 | 99 | 166 | 564 |
| Utah | – | 0 | 194 | 1130 |
| Vermont | 2 | 27 | 15 | 9 |
| Virginia | – | 1 | 26 | 181 |
| Washington | – | 0 | 0 | 0 |
| Washington, D.C. | – | 0 | 0 | 0 |
| Wisconsin | 1 | 0 | 0 | 0 |
| Other | 12 | 9 | 55 | 72 |
| Total | 1,444 | 3922 | 4265 | 10594 |
Overview of Governance
A variety of policies can support the growth of the PV manufacturing industry; depending on policy specifics, they may potentially encourage competition within the industry or enable certain firms to secure their positions. Relevant policies include import tariffs and other trade restrictions, tax incentives, and research and development funding. The presence of policies supporting the installation of PV may also encourage manufacturers to locate in the region. The differences in policies across countries, regions, and states strongly contribute to PV manufacturers’ choices of facilities locations, as discussed in the previous section on geographies.
International Trade
Trade Balance
Many countries both import and export polysilicon and PV cells and modules, although some are almost purely PV producers or consumers (Figure SC.14). Individual countries’ statuses as net importers or net exporters have shifted over time as the global market for PV modules and their components have matured and as new PV technologies are developed. Currently, China and Taiwan are major exporters of PV modules, while Japan and the U.S. are both net module importers. Figure SC.14 focuses on global trade in PV modules, showing trade flows between countries.
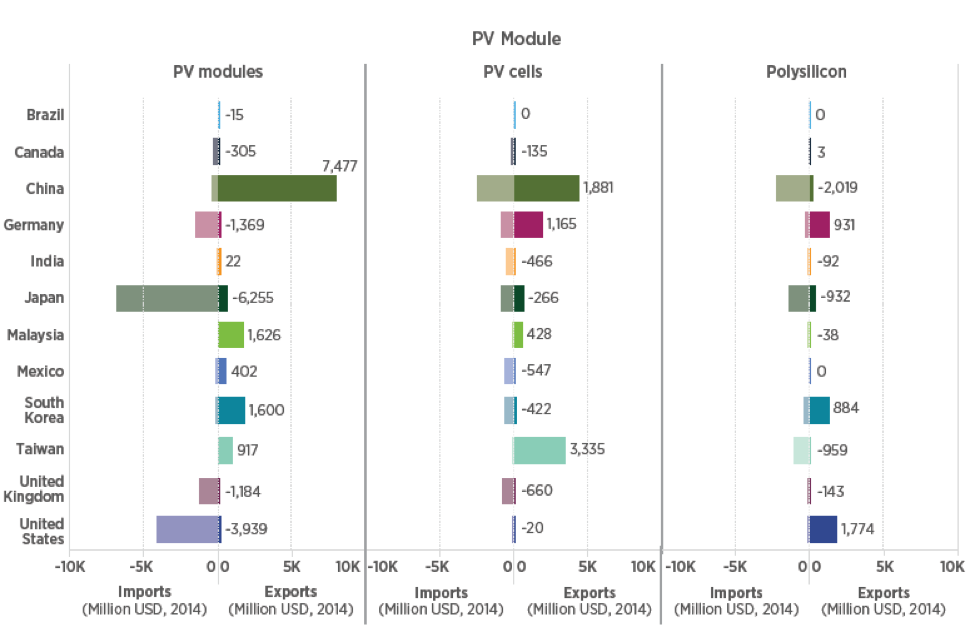
Figure SC.14 Balance of Trade for PV products in Major Countries
Source: : Figure ES-8 from CEMAC (2017) Benchmarks of Global Clean Energy Manufacturing
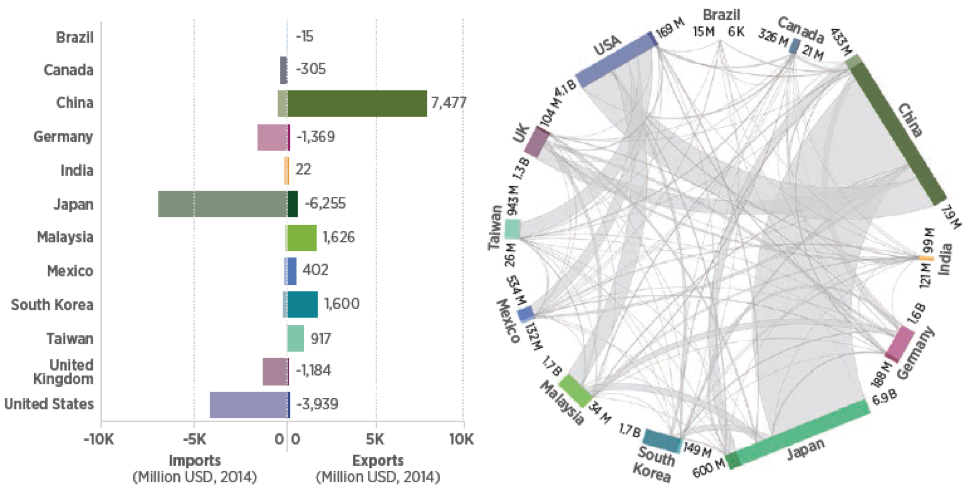
Figure SC.15 PV Module Trade Flows between Major Countries
Source: Figure ES-7B from CEMAC (2017) Benchmarks of Global Clean Energy Manufacturing
While the U.S. is a net importer of PV modules, it exported $350 million worth of cells and modules in 2013, primarily to Japan and Germany. In 2014, the primary importers of U.S. PV modules were Canada, Germany, and the United Kingdom (Figure SC.15). Several agreements and policies exist to support U.S. PV exporters, including the Information Technology Agreement, the Renewable Energy and Energy Efficiency Export Initiative, and a 2016 environmental technologies initiative. However, U.S. manufacturers generally remain at a cost disadvantage compared to lower-wage countries and countries with substantial government support of PV manufacturing. Requirements or preferences for the use of locally manufactured goods also provide substantial barriers to U.S. export to such places as India, Canada, South Africa, Saudi Arabia, and Italy.
Tariffs
Trade tariffs impact the manufacturing components of the PV value chain at the global level, in terms of module shipments between countries and manufacturer capacity expansion and merger/joint venture decisions. As many of the top wafer and module manufacturers are based in China, Chinese import tariffs also play a role in the market landscape for U.S. and European polysilicon producers; some producers, such as REC Silicon and Wacker Chemie AG, have formed joint ventures with Chinese manufacturers or negotiated with the Chinese government to ensure a market-clearing price for their products.
Since 2011, the U.S., China, the European Union, and India have lodged anti-dumping complaints regarding other countries’ exports of polysilicon and PV cells and modules. These cases may involve the U.S. Department of Commerce, the International Trade Commission, and the World Trade Organization. The most common response to the dumping of exports is for the importing country to impose a tariff (or duty) to bring the product prices in line with the domestic market. Most PV tariffs are designed to last for a limited number of years and to decrease over time. Recent tariffs are summarized in Table SC.4.
Table SC.4 Recent PV Tariffs
Sources: SEIA 2016; Congressional Research Service report; IBISWorld 2017.
| Importing Country | Exporting Country | Product | Year | Tariff |
| U.S. | China | Cells and modules | 2012 | Average of 24.5% |
| China | U.S., South Korea | Polysilicon | 2014 | 53-57% |
| U.S. | China, Taiwan | Cells and modules | 2015 | 11-50% |
| U.S. | Foreign Countries | Cells and modules | 2018 | 30% |
U.S. Government Supports
U.S. policies favoring development of a domestic solar power sector include federal- and state-level regulatory policy, financial support for the U.S. solar PV manufacturing industry, as well as tax incentives for solar generation of electricity. Here we focus on the past support programs directly targeting solar manufacturers. Other programs that have more direct impact on solar project development are discussed in the Project Development and EPC value chain step. Recent policies with a significant impact of U.S. PV module manufacturing include:
Department of Energy’s (DOE’s) Loan Guarantee Program, Section 1703 of Title XVII of the Energy Policy Act (EPAct) of 2005:
This program guaranteed loans for projects with “high technology risks that avoid, reduce or sequester air pollutants or anthropogenic emissions of greenhouse gases; and employ new or significantly improved technologies as compared to commercial technologies in service in the United States at the time the guarantee is issued.”
Advanced Energy Manufacturing Tax Credit, Section 48C, of the American Recovery and Reinvestment Act of 2009:
30% investment tax credit for qualified investments in manufacturing facilities, including establishing, expanding, or re-equipping a manufacturing facility for the production of “property designed to be used to produce energy from the sun, wind, geothermal deposits, or other renewable resources.” In Phase I of this program (2009), $2.3 billion in credits were offered and allocated. In Phase II of this program, $150 million in credits were offered and allocated.
Reauthorization of the Loan , of the American Recovery and Reinvestment Act of 2009:
This policy added additional funds to the Loan Guarantee Program, but was retired in 2011; PV loan guarantees are now only available through Section 1703. Of note, the former PV manufacturer Solyndra received a $535 million loan under Section 1705, on which it defaulted upon declaring bankruptcy. Several other solar manufacturers defaulted on Section 1705 loans as well.
SunShot Initiative:
The SunShot 2020 Initiative is a multifaceted program launched by the U.S. Department of Energy with the aim of reducing the costs of PV by 75%, to $1/watt or $0.06/kWh for utility-scale solar, by 2020; SunShot 2030 later added a goal of $0.03/kWh by 2030. The DOE awarded funding to numerous projects to support the development and commercialization of advanced solar technologies. Key components of the SunShot Inititative include:
- SunShot Incubator: This program aims to lower the installed cost of solar energy by supporting the transition from breakthrough innovation to commercialization and overcoming technological barriers that present risks unsuitable to traditional private sector funding sources; it combines government funding with venture capital investment. Over 100 startups have participated in this program since it began in 2007, receiving $138 million in federal grants. The Incubator program is run in tandem with other funding opportunities provided by the DOE’s Solar Energy Technologies Office.
- Advanced Solar Photovoltaic Manufacturing Initiative: This component of the SunShot program focused specifically on reducing the capital requirements of PV module manufacturing.
- Scaling Up Nascent PV at Home (SUNPATH): Under this program in 2011, DOE provided $37 million to three projects aiming to scale up advanced PV technologies to high-volume, commercial production. Recipients included two concentrating PV manufacturers. This project was also supported by the Department of Defense, with the goal of strengthening energy security.
Advanced Research Projects Agency-Energy (ARPA-E):
ARPA-E was created in 2007 under the America COMPETES Act to “catalyze transformational energy technologies to enhance the economic and energy security of the United States… [by funding] high-potential, high-impact energy projects that are too early for private sector investment but could significantly advance the ways we generate, store, distribute and use energy.” ARPA-E funded its first portfolio of projects in 2009. While ARPA-E addresses many aspects of electricity generation, energy efficiency, and the electrical grid, several programs relevant to PV technologies are MOSAIC (Micro-scale Optimized Solar-cell Arrays with Integrated Concentration), Solar ADEPT (Solar Agile Delivery of Electrical Power Technology), and FOCUS (Full-Spectrum Optimized Conversion and Utilization of Sunlight).
Quantitative Measurement of Imperfect Competition
Four Firm Concentration Ratio (FFCR)
“Semiconductor and Related Device Manufacturing” (NAICS 334413) is the closest six-digit code industry that covers the PV module manufacturing step. Note that this industry code also includes a range of components, products or services other than solar module manufacturing.
Table SC.5 FFCR for Semiconductor and Related Device Manufacturing (NAICS 334413)
Source: 2012 U.S. Economic Census, Manufacturing: Subject Series: Concentration Ratios: Share of Value of Shipments Accounted for by the 4, 8, 20, and 50 Largest Companies for Industries: 2012.
| Year | Firms | Number of Companies | Number of Establishments | Number of Employees | Total Value of Shipments ($1,000) | % of total Value of Shipments and receipts for services | % of Value of Shipment by the HHI for 50 Largest companies (%) |
| 2012 | All firms | 793 | $48,613,197 | 100.0 | |||
| 2012 | 4 largest firms | 38.9 | |||||
| 2012 | 8 largest firms | 55.1 | |||||
| 2012 | 20 largest firms | 73.5 | |||||
| 2012 | 50 largest firms | 86.9 | 553.8 |
Herfindahl-Hirschman Index (HHI)
As suggested in Figure SC.4, the threat of new entrants becomes more severe moving down the solar value chain (from polysilicon, to wafer, to cell, to module), as there are more competing companies in later steps. Similarly, Powell et.al estimated the HHI for each of the solar module sub-steps, and the results indicate that polysilicon has the highest HHI score followed by wafer, cell, and then modules implying that polysilicon industry has the highest concentration relative to its subsequent value chain steps(Figure SC.16).
![]()
Figure SC.16 HHI for Sub-Steps of Silicon PV Manufacturing
Source: Figure 7 from Powell et al. 2015 The Capital intensity of photovoltaics manufacturing: barrier to scale and opportunity for innovation
Using PV module manufacturer market share information from Bloomberg Intelligence, we estimated the HHI of the PV module industry for 2014 – 2016. For more information on the HHI metric, see the glossary.
Table SC.6 HHI Calculation for Top Module Producers
Source: Bloomberg Intelligence Solar Data
| Firm | Market Share 2016 | Market Share 2015 | Market Share 2014 |
| Canadian Solar Inc | 14.8% | 14.9% | 13.7% |
| First Solar Inc | 15.3% | 15.4% | 15.7% |
| GCL-Poly Energy Holdings Ltd | 17.2% | 14.0% | 16.2% |
| Hanwha Q CELLS Co Ltd | 12.6% | 7.8% | 3.6% |
| JA Solar Holdings Co Ltd | 12.3% | 9.3% | 8.5% |
| Motech Industries Inc | 4.7% | 3.4% | 3.15 |
| REC Silicon ASA | 1.4% | 1.4% | 2.3% |
| ReneSola Ltd | 4.8% | 5.5% | 7.2% |
| Solarworld AG | 4.6% | 3.7% | 3.5% |
| Trina Solar | 13.1% | 10.6% | |
| Wacker Chemie Polysilicon Division | 5.8% | 4.7% | 5.9% |
| Yingli Green Energy Holding Co Ltd | 6.5% | 6.8% | 9.7% |
| Implied HHI | 1203 | 1102 | 1103 |
Firm Economic Data Table
Table SC.7 lists firm revenues, number of employees, as well as location of headquarter and manufacturing facilities. More detailed firm information can be found in their annual report or company website (link provided).
Table SC.7 Key Financial Metrics of Selected PV Module Manufacturers
| Firm Name | Revenue (million) | Quantity of relevance (e.g., shipments, # of projects/installations, power generated, etc.) – (to enable imperfect competition calculations) | Market share | HQ Location | Ticker symbol (if available) | Web address of firm annual report |
| JinkoSolar | $728.1 (2018q1) | 2,015 MW (2018q1) | China | JKS | Q1 2018 Financial Results | |
| Trina Solar | $3,035.5 (2015) | China | Source: Blomberg Intelligence | |||
| Canadian Solar | $650.6 (2018q2) | 1,700 MW (2018q2) | Canada | CSIQ | Q2 2018 Financial Results | |
| JA Solar | $2,369.8 (2016) | China | Source: Blomberg Intelligence | |||
| Hanwha Q CELLS | $2,188.9 (2017) | South Korea | HQCL | SEC Form 20-F | ||
| GCL-SI | Hong Kong | n/a | ||||
| LONGi Solar | China | n/a | ||||
| Risen Energy | China | n/a | ||||
| Shunfeng | $864 (modules in 2017) | 2,475 MW (modules in 2017) | China | 2017 Financial Report | ||
| Yingli | $1,285.5 (2017) | China | SEC Form 20-F | |||
| First Solar | $309.3 (2018q2) | USA | FSLR | Q2 2018 Financial Results |