Direction and Rate of Technological Change
Aerodynamic modeling is used to determine the optimum design of wind turbine. Currently, the horizontal-axis wind turbine with three blades is the dominant design for wind turbine; these turbines have the main rotor shaft and electrical generator at the top of a tower and must be pointed into the wind. Modern wind turbines are designed to spin at varying speeds; hence a pitch control mechanism enables blades to adjust their angle of attack and optimizes aerodynamic efficiency.
As the average rotor diameter has grown from 53 meters in 2000 to 113 meter in 2017, blade material has become an important factor in blade design. Materials that are typically used for the rotor blades in wind turbines are composites, as they tend to have high durability, high strength, high fatigue resistance, and low weight. Typical materials for the wind turbine blade market include resins of glass fiber reinforced polyester, glass fiber reinforced epoxy, and carbon fiber reinforced epoxy. As the manufacturing cost of glass fibers is currently lower than carbon fiber, rotor blades made with fiber glass are the dominant design.
Given the continued competitive pressure from other wind turbine manufactures and other energy sources, as well as a general move to electricity auction mechanisms, wind turbine manufacturers are facing increasingly high price pressure. As a result, wind turbine manufacturers are making strategic investment in research and development to keep wind energy economically competitive through constant product innovation including larger rotors, taller towers and higher nameplate ratings. For instance, GE Renewable Energy acquired LM Wind Power in 2017, a leading wind rotor blade producer from Denmark for $1.7 billion (USD). By in-sourcing blade production to develop larger and more efficient turbines, GE improves its ability to increase wind energy output while lowering the cost of wind turbine manufacturing. LM Wind Power also made numerous breakthrough developments in blade design focused on noise reduction, effective de-icing solution and composite advancement (Hybrid Carbon technology). A British-based blade manufacturer, Blade Dynamics, which was purchased by GE Renewable Energy in 2015 has developed a transformational modular blade concept that aims to reduce blade weight and increase reliability. This new technology offers scalable blade architecture enabling lower manufacturing cost and provides a more cost-effective solution to transportation challenges faced by current blade technology. Siemens (now Siemens Gamesa) also introduced several major innovations in their blade technology. One of the advancements in blade making process is to cast a blade in one piece to eliminate weaker areas at glued joint and to achieve optimal performance, strength and reliability. Siemens (now Siemens Gamesa) also redesigned the blade tip and blade bending capability in their most recent turbine models to minimize loads and at the same time to optimize its energy output.
To help improve the productivity in domestic blade manufacturing, Department of Energy (DOE) partners with public and private entities to make advancements in composite materials, automations, and advanced manufacturing processes. DOE is also exploring the application of additive manufacturing technology, commonly known as 3D printing, on the production of wind rotor blades. This technology could save time and money during the blade development process. More information on DOE’s initiative on advanced blade manufacturing process can be found on DOE’s website: https://www.energy.gov/eere/wind/advanced-blade-manufacturing.
Data on Quantity, Cost, and Quality
Table IO.1 Attributes for Learning Curve Estimation
Source: Data from Figures 12 and 20 in U.S. Department of Energy 2017 Wind Technologies Market Report
| Year | Blade Production Capacity (number of blades) | Average Rotor Diameter (meters) |
| 1998-99 | 48 | |
| 2000-01 | 53 | |
| 2002-03 | 64 | |
| 2004-05 | 74 | |
| 2006 | 78 | |
| 2007 | 79 | |
| 2008 | 79 | |
| 2009 | 82 | |
| 2010 | 84 | |
| 2011 | 89 | |
| 2012 | 12,541 | 93 |
| 2013 | 11,007 | 97 |
| 2014 | 10,834 | 99 |
| 2015 | 10,498 | 102 |
| 2016 | 11,300 | 108 |
| 2017 | 11,550 | 113 |
| Source: | Figure 12 | Figure 20 |

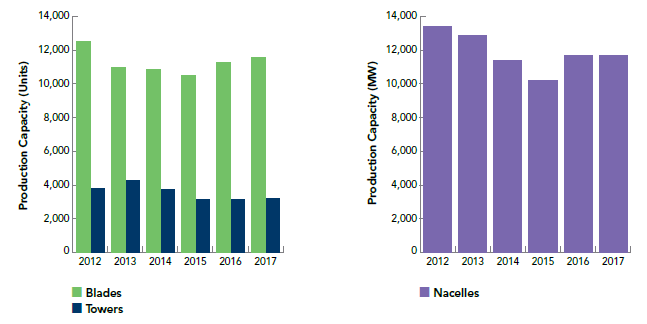
Figure IO.1 Manufacturing Production Capacity for Major Components of Towers, Blades and Nacelle
Source: Figure 84 from AWEA 2017 U.S. Wind Industry Annual Market Report Year